
Storage Monitoring
MetricsHub monitors enterprise storage systems across leading vendors, including Dell, Hitachi, HPE, IBM, NetApp, Pure and more.
It collects critical metrics from storage arrays, controllers, disks, and storage pools, including IOPS, throughput, latency, capacity utilization, and storage provisioning.
By providing deep visibility into usage and growth trends, MetricsHub helps optimize storage utilization, prevent over-provisioning, and reduce unnecessary storage spending.

Managing Capacity Growth and Performance in Modern Storage Environments
The rapid growth of data, AI-driven workloads, and hybrid architectures is placing increasing pressure on enterprise storage systems. Teams must balance capacity expansion with performance requirements, cost control, and infrastructure reliability while ensuring applications remain responsive and available.
How MetricsHub Monitors Storage
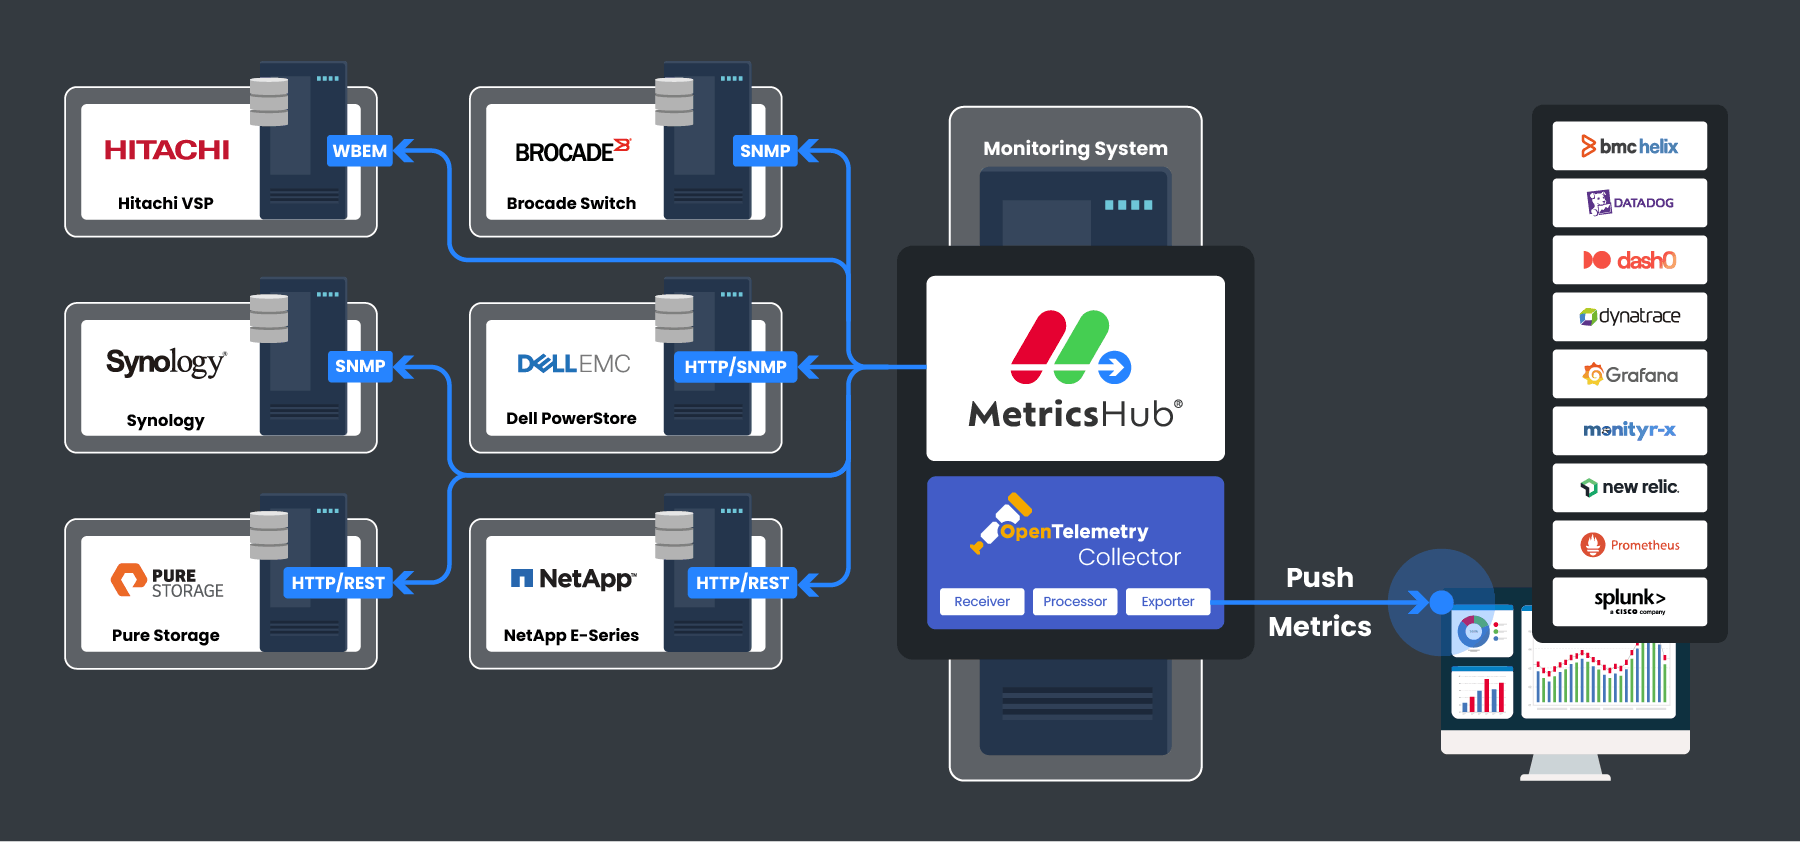
MetricsHub is a collection agent deployed within your infrastructure. A single instance can remotely monitor many storage systems.
MetricsHub uses a modular, connector-based architecture. Each storage connector contains the logic required to collect health, capacity, and performance metrics using vendor APIs. MetricsHub adapts to each vendor platform while normalizing metrics into a consistent OpenTelemetry data model.
MetricsHub is designed to complement, not replace, your observability platform. Collected metrics are exported through the embedded OpenTelemetry Collector to platforms such as Prometheus, Grafana, Datadog, BMC Helix, Cisco Splunk, and others.
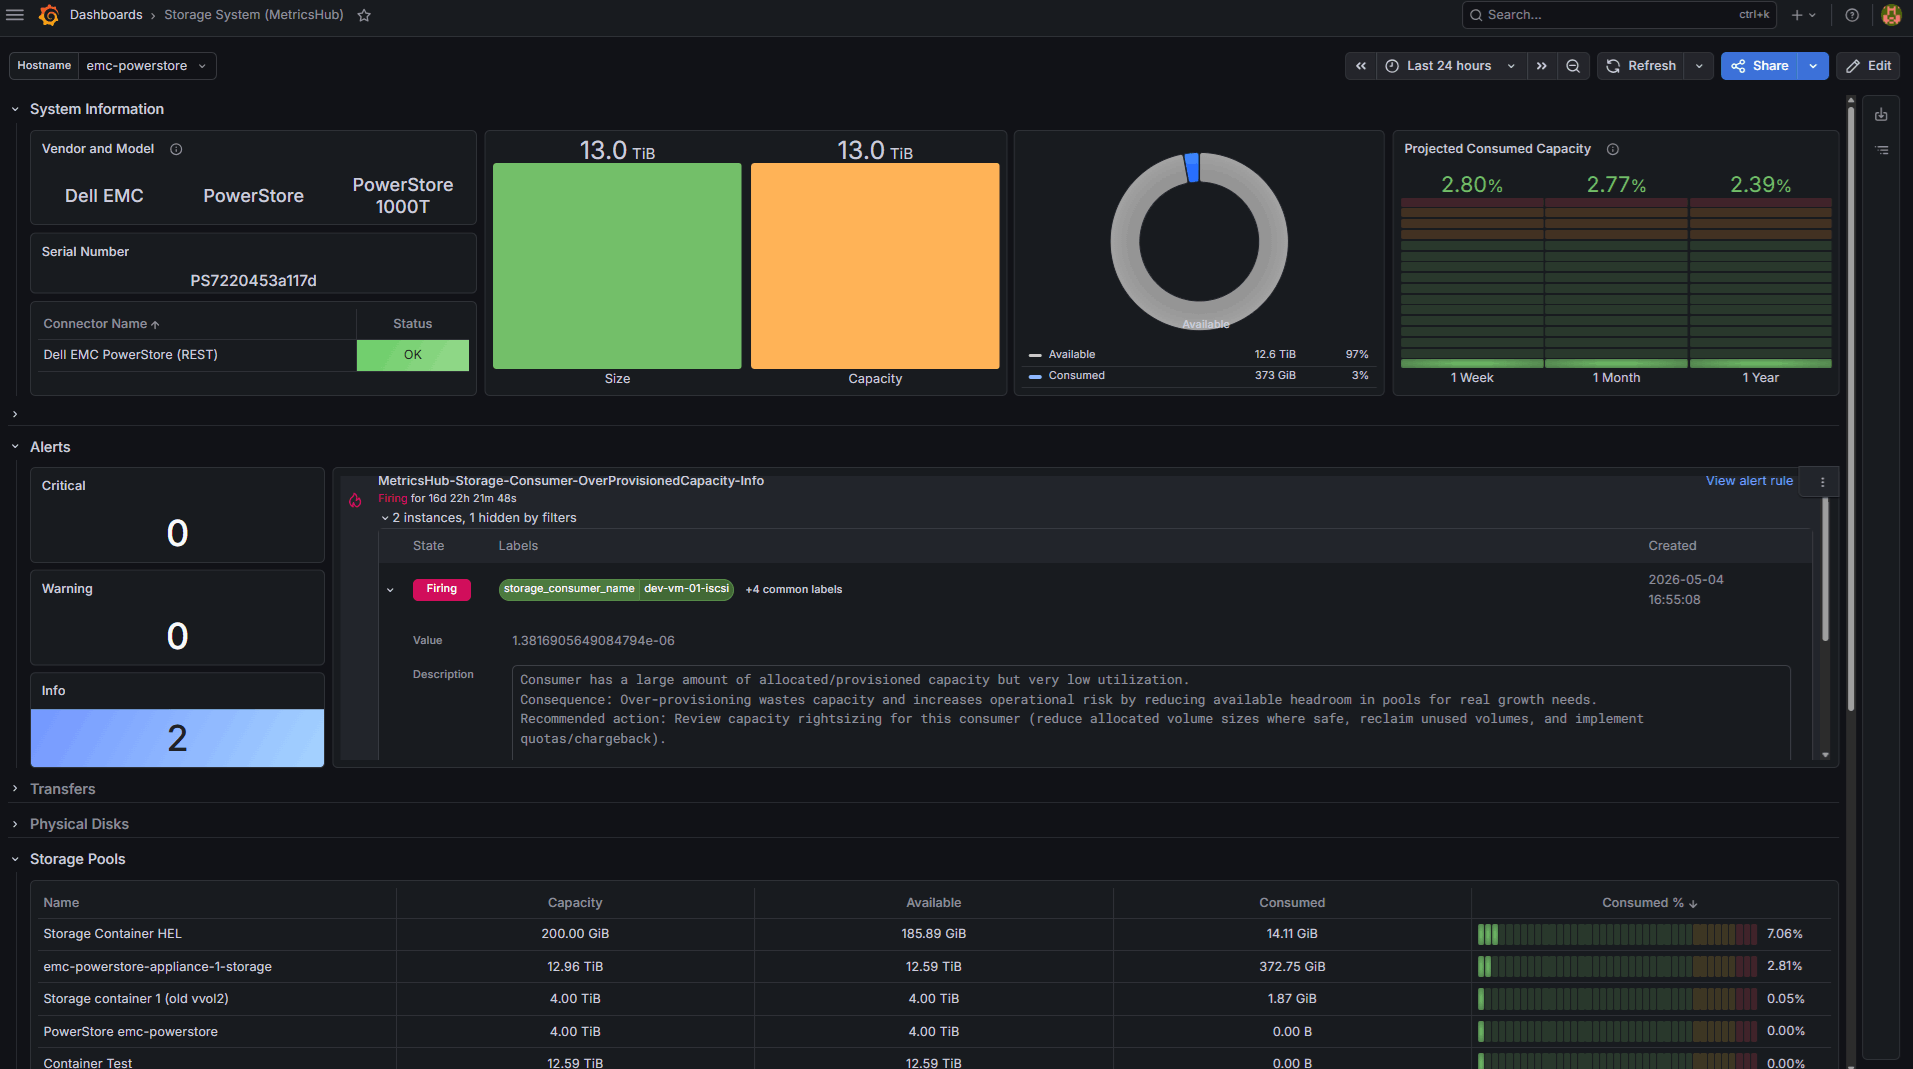
Prevent Capacity Shortfalls
Anticipate capacity issues before they impact applications.
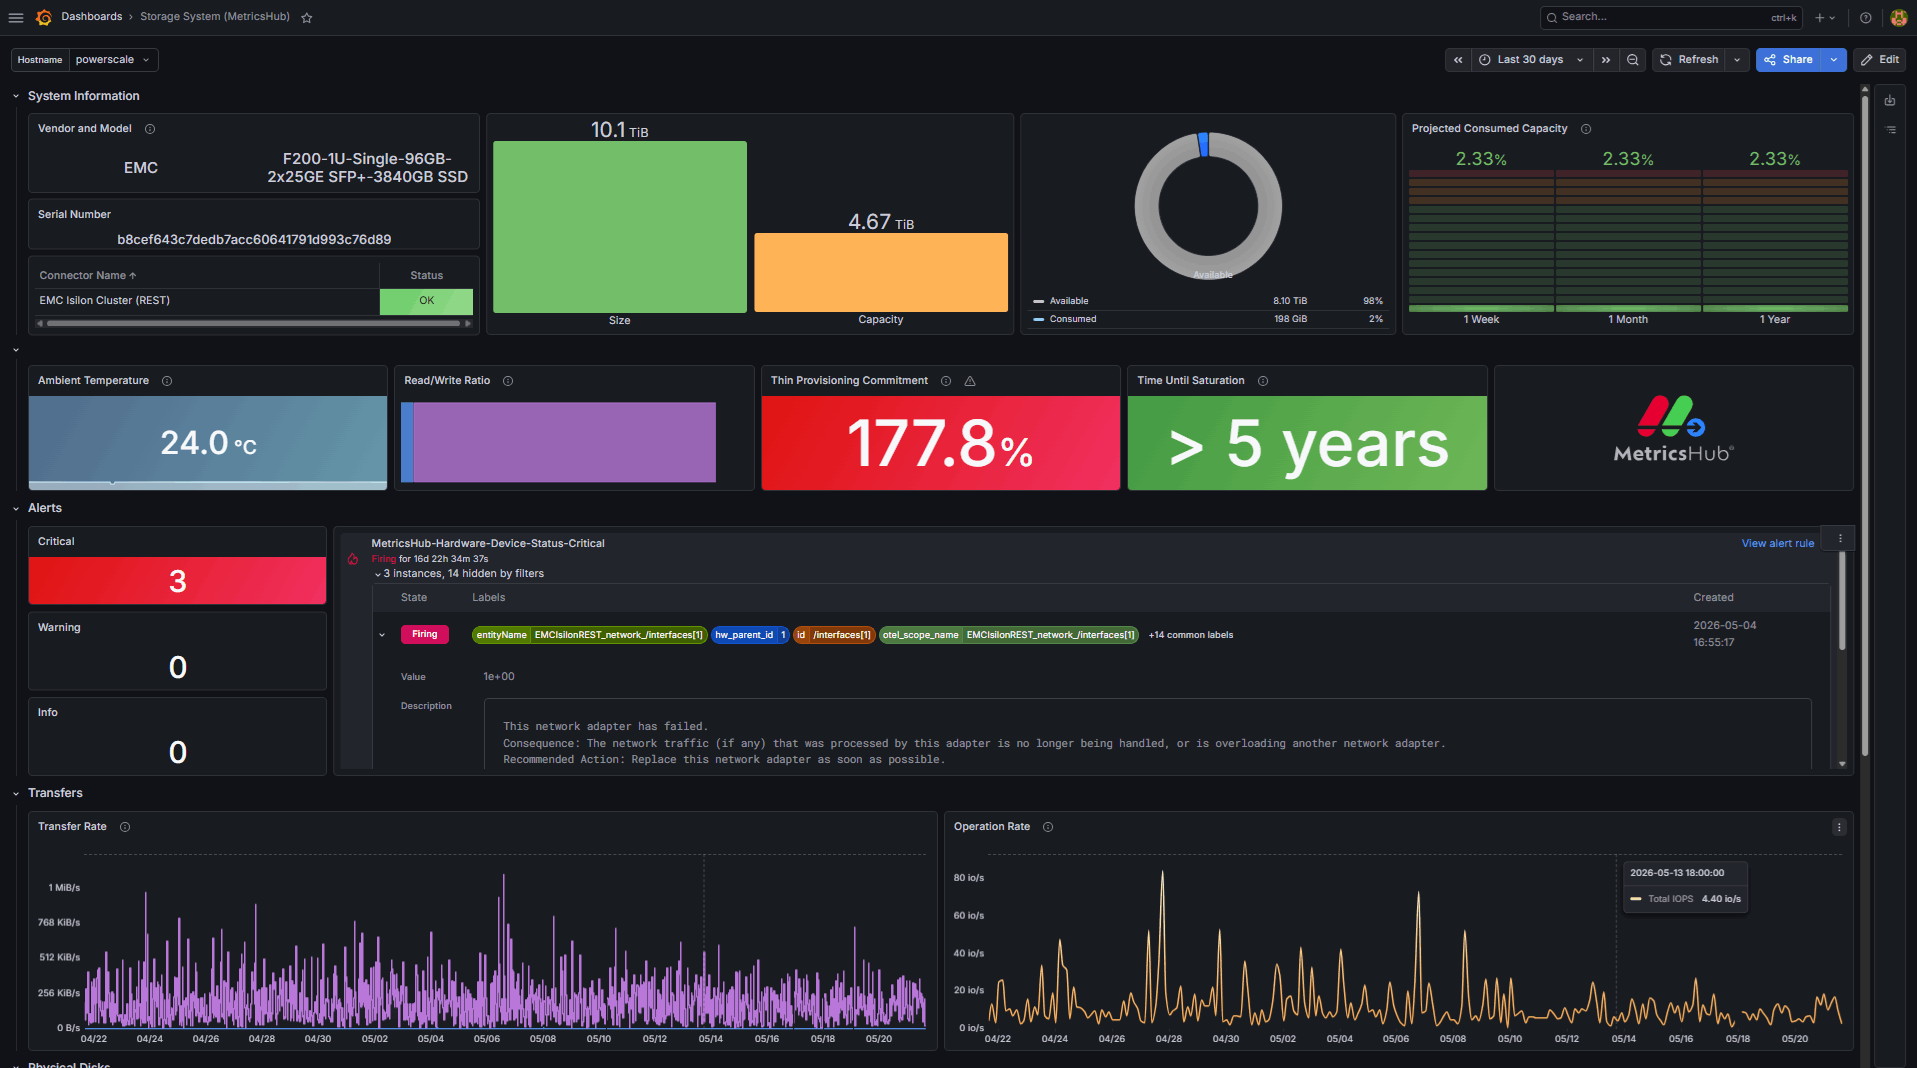
- Track configured, subscribed, consumed, and available capacity across systems and pools
- Monitor thin provisioning commitment and over-subscription ratios
- Visualize projected capacity growth and estimate time until saturation
- Detect abnormal growth trends at the pool, volume, or consumer level
Detect Performance Bottlenecks
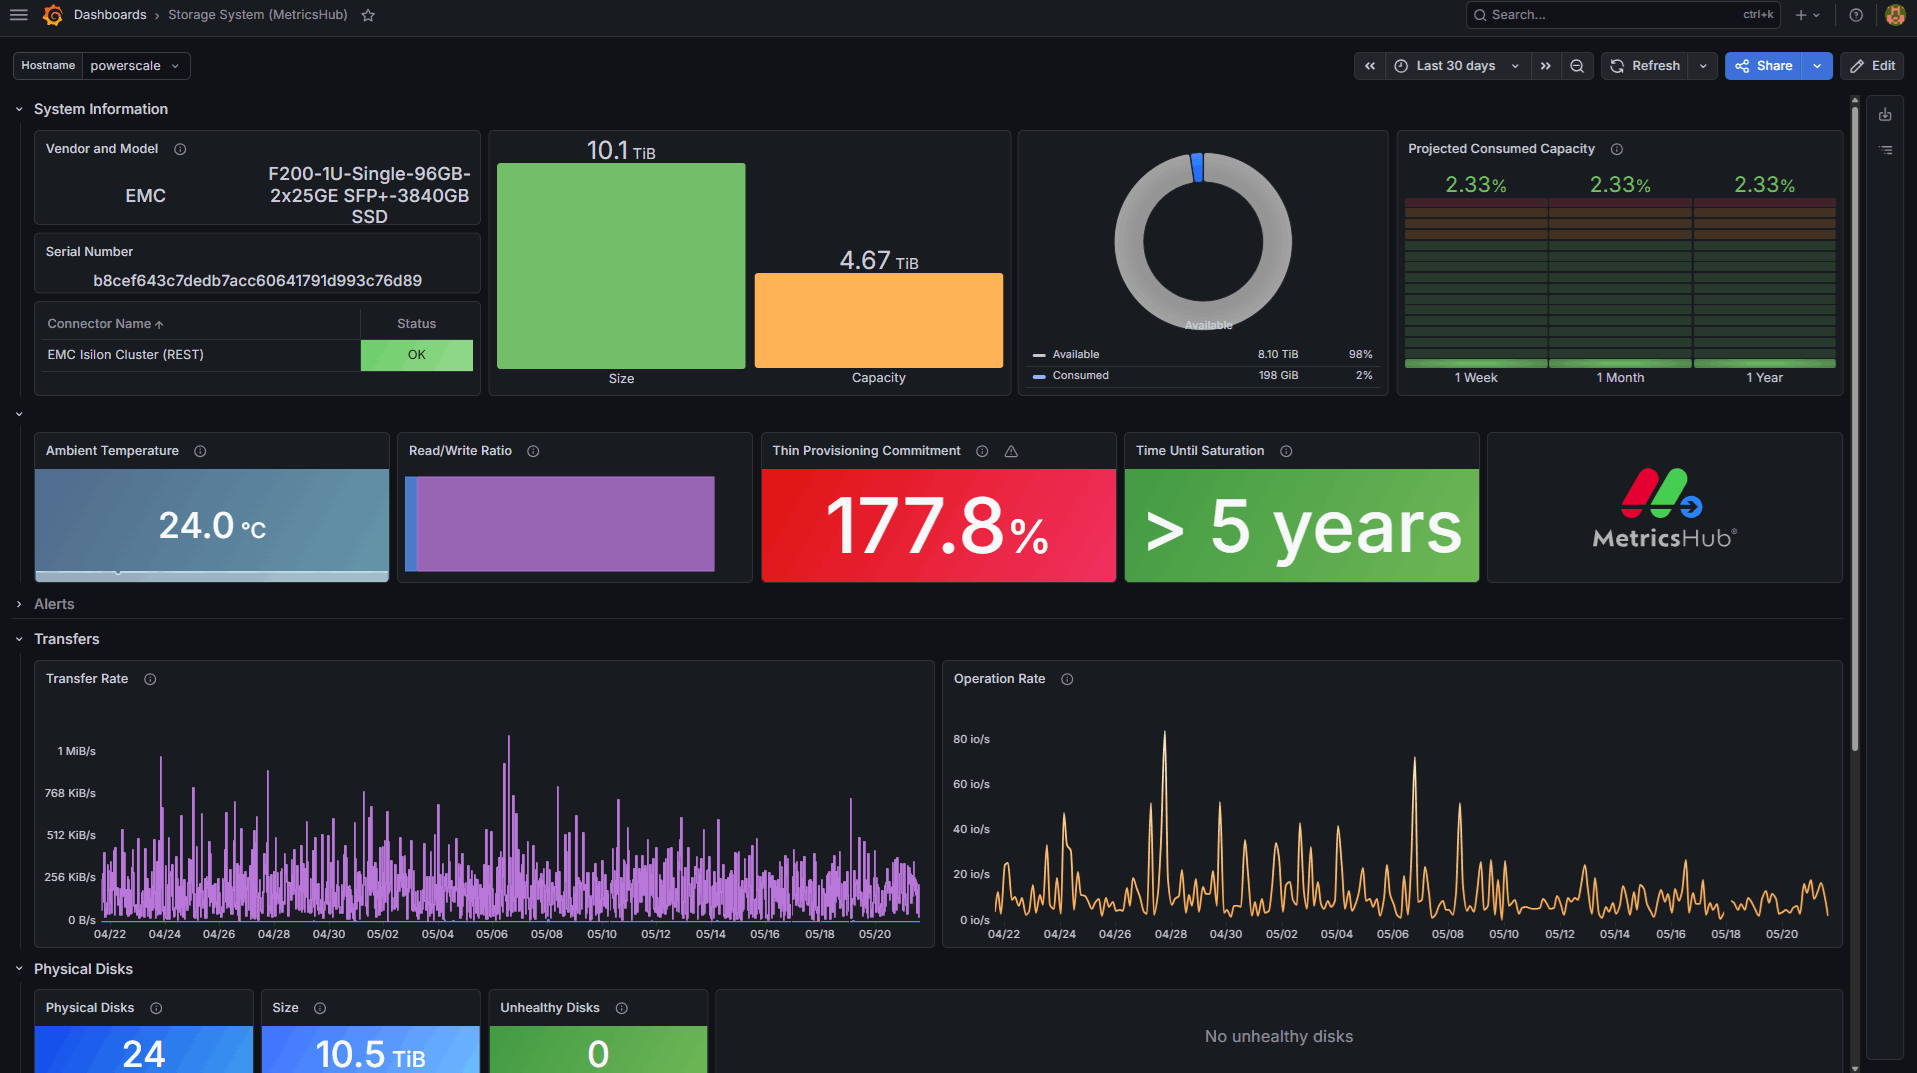
Measure detailed performance metrics at each layer, from disks to controllers, storage pools, and volumes to identify saturated components and unbalanced workloads:
- Latency
- IOPS
- Throughput
- Read/write ratios
Optimize Storage and Reduce Costs
Improve how storage resources are allocated and consumed.
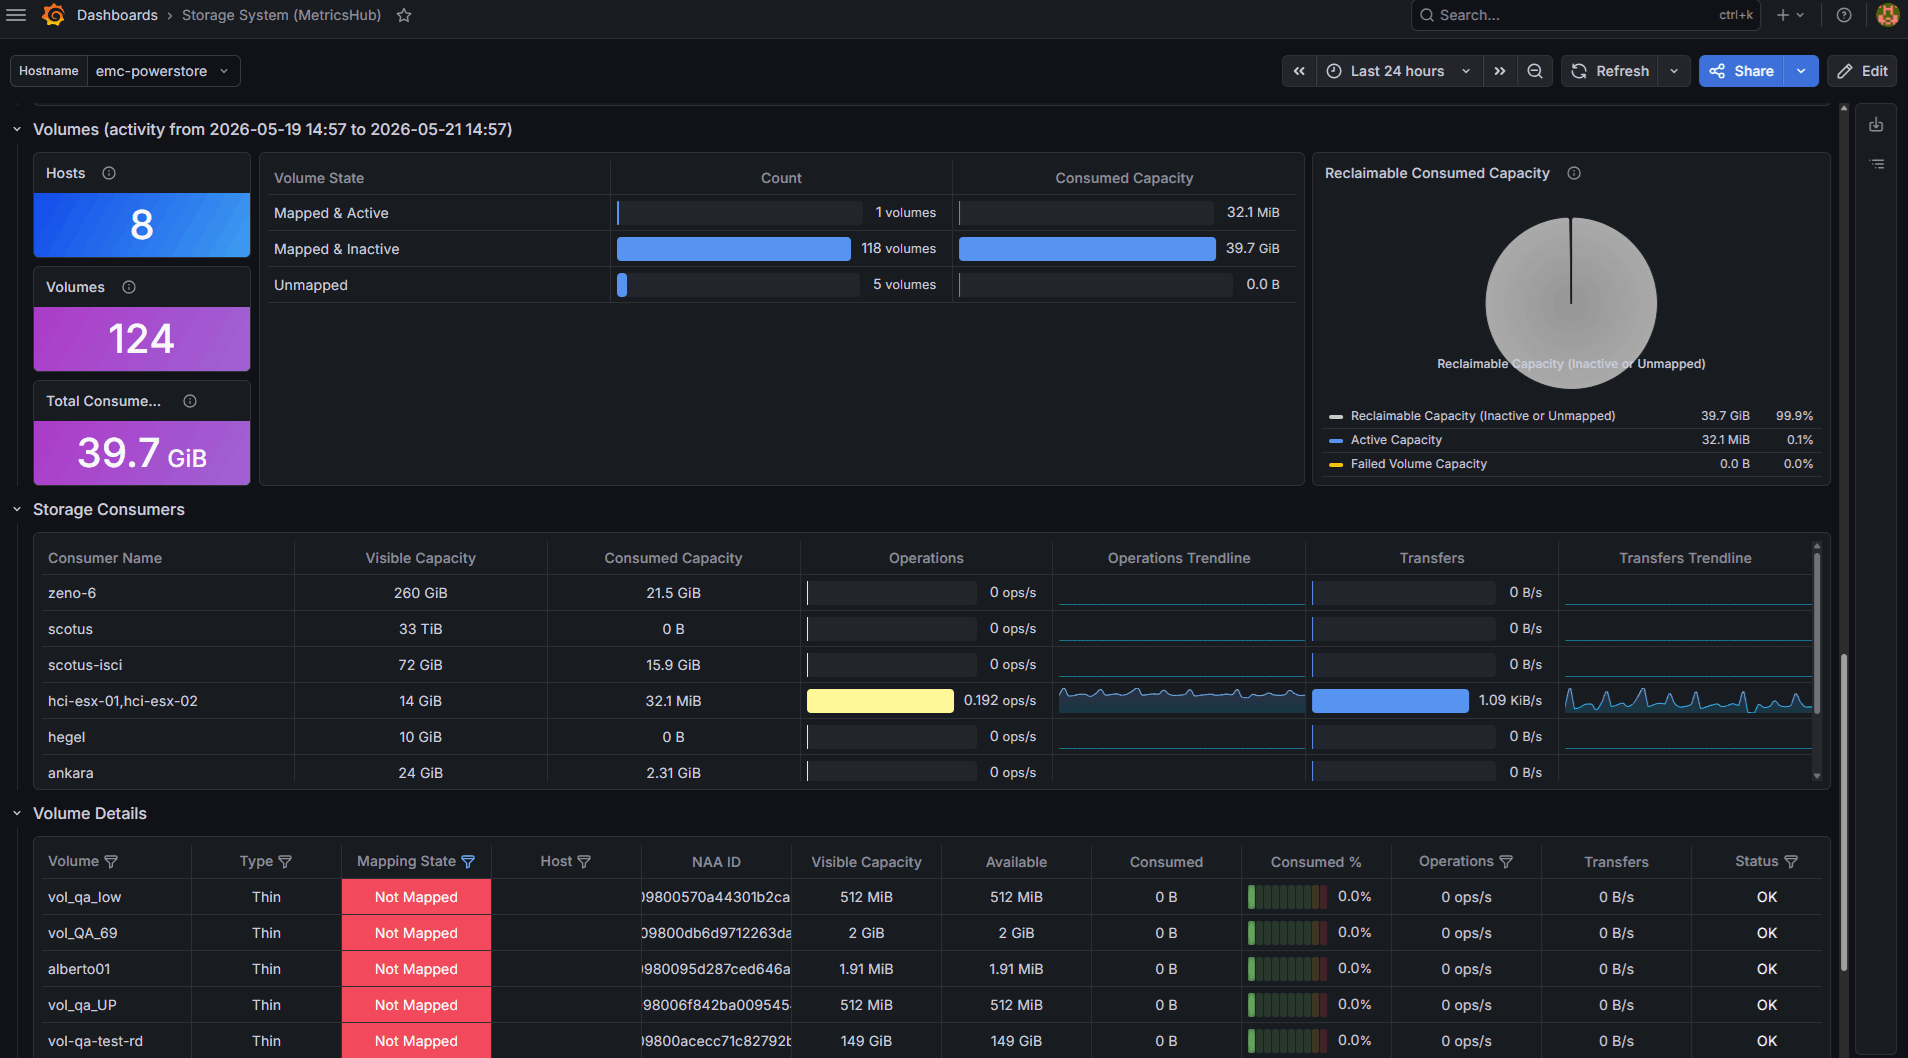
- Report actual usage to storage consumers
- Reclaim space from inactive, unmapped, or underutilized volumes
- Analyze capacity consumption trends per host
- Detect imbalances across your entire storage infrastructure
Monitor Hardware Health and Reduce Risk
Reduce the risk of data loss and unplanned downtime.
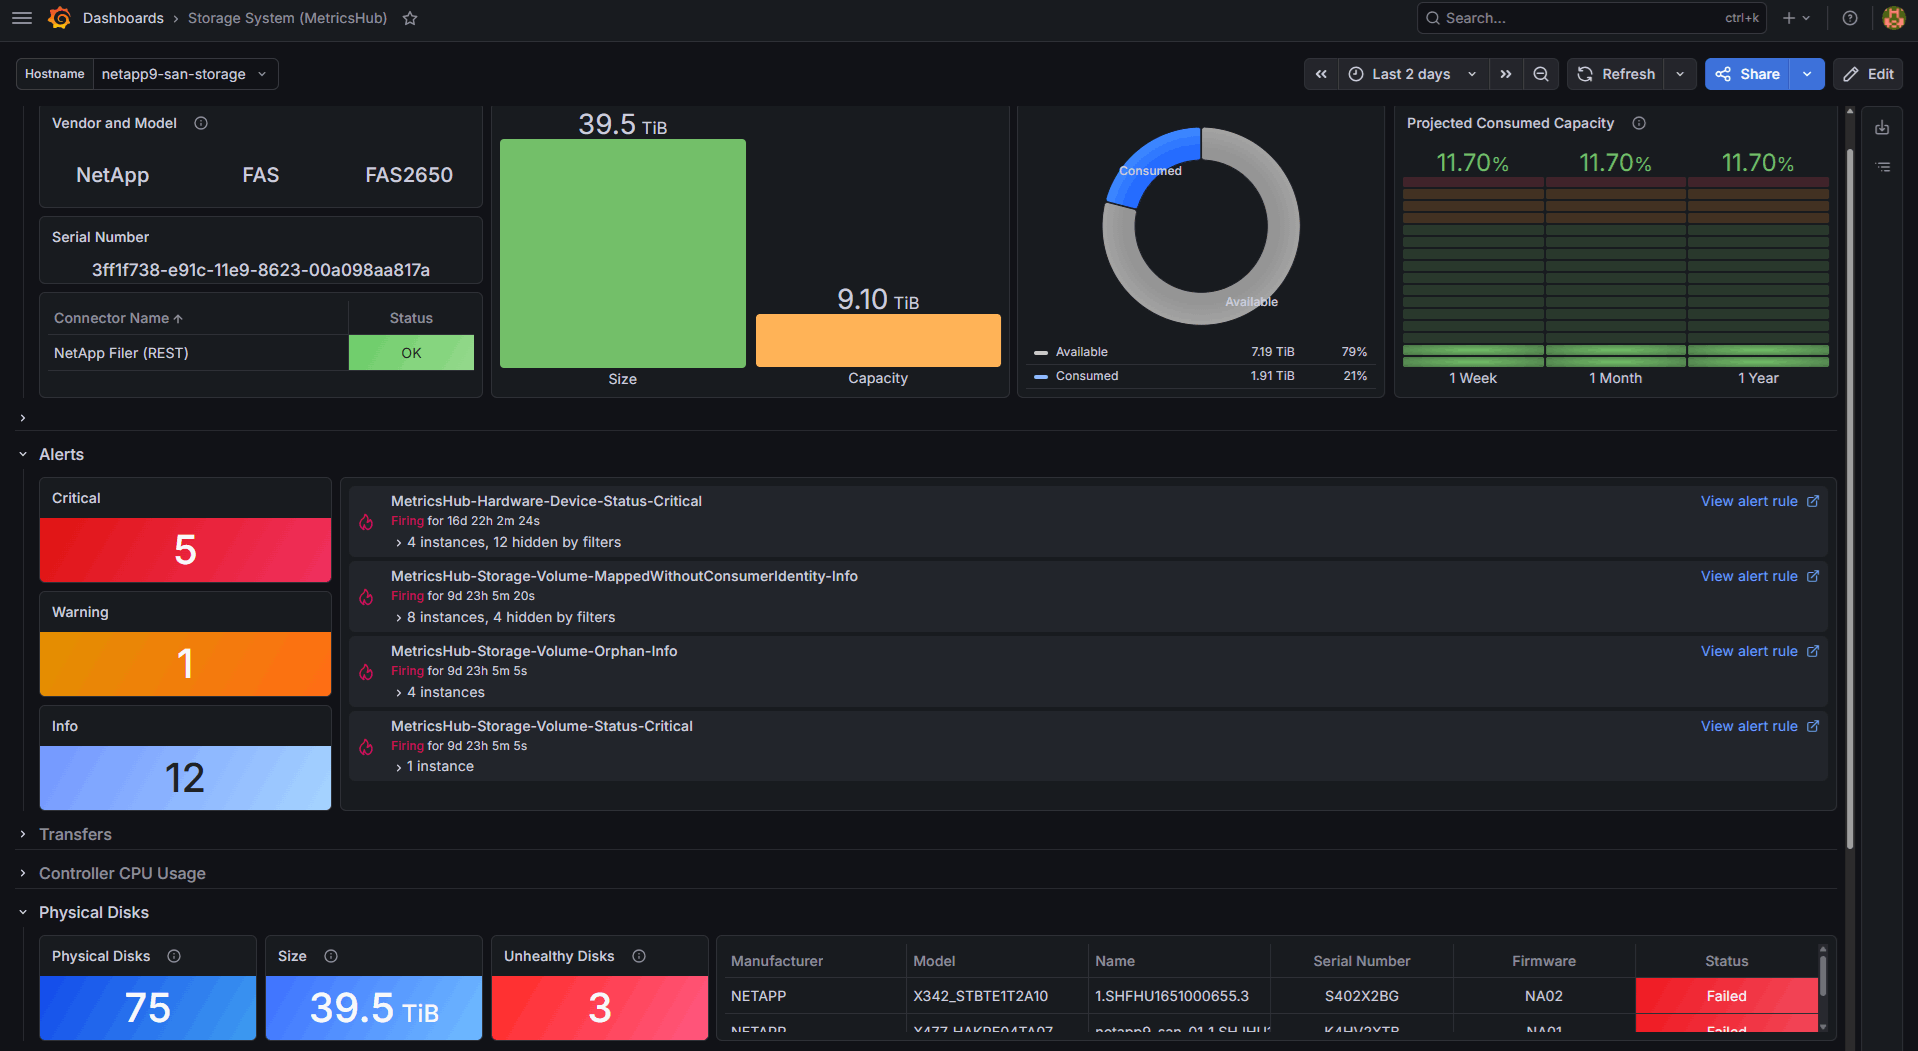
- Closely monitor physical disks to predict failures
- Detect degraded or failing components, notably ports, batteries, cooling, power supplies, and more.
Seamless Integration with Your Existing Observability Platform
- Expose the collected metrics into your existing observability platform through the embedded OpenTelemetry Collector
- Understand the health of your storage infrastructure at a glance with our prebuilt dashboards
- Receive alerts through your existing alerting systems, including Prometheus Alertmanager, Datadog Monitors, BMC Helix Alarm Policies, and others
You Need MetricsHub if You:
Face rising storage costs and need better control over capacity and utilization
Manage multi-vendor enterprise storage systems and want to eliminate fragmented, vendor-specific monitoring tools
Need to ensure storage performance keeps pace with workload demand