Server Monitoring
MetricsHub monitors servers at both the operating system and hardware levels, providing a comprehensive and unified view of server health.
It collects performance metrics from Linux, Windows, and UNIX systems while extending visibility to the underlying physical components that affect service continuity.
All metrics follow OpenTelemetry semantic conventions, enabling seamless integration with your existing observability platform.

Not Just the Operating System, Hardware Down to the Rack
Modern observability platforms provide strong visibility into system performance (CPU utilization, memory usage, application metrics) but often overlook the physical hardware running underneath. Yet many service disruptions originate at the hardware level.
MetricsHub extends monitoring beyond the operating system to include hardware components down to the rack level.
How MetricsHub Monitors Servers
MetricsHub is a collection agent deployed within your infrastructure. A single instance can remotely monitor up to 1,000 hosts, eliminating the need to deploy an agent on every server.
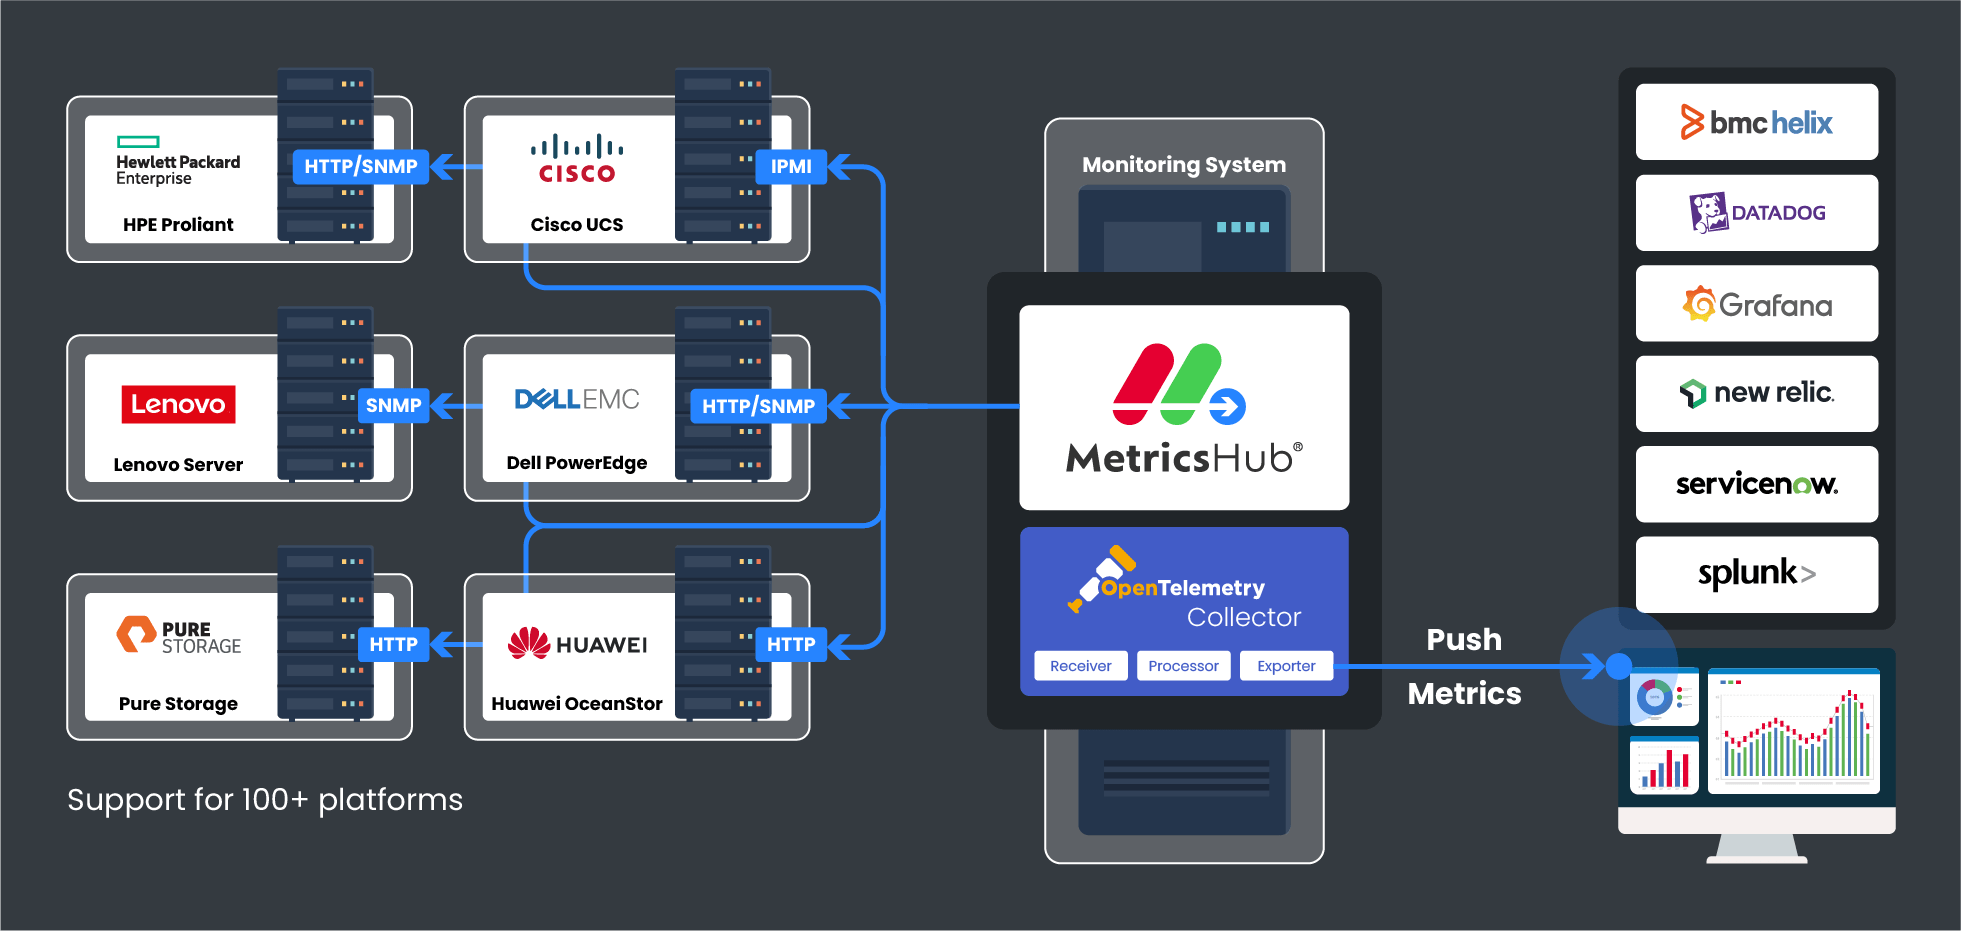
MetricsHub uses a modular, connector-based architecture. Each connector contains the logic required to collect server and hardware metrics using standard access methods.
With 300+ built-in connectors, MetricsHub can monitor servers across a broad range of vendors, models, and generations, from legacy UNIX servers to modern GPU-accelerated platforms.
Depending on the protocols enabled on each system (SNMP, SSH, IPMI, Redfish, or WMI/WinRM), MetricsHub automatically selects the appropriate connectors to collect metrics.
MetricsHub is designed to complement, not replace, your observability platform. The collected metrics can be sent to any OpenTelemetry-compatible platform, including Dash0, Datadog, Grafana, Cisco Splunk, and others.
300+ Connectors to Cover Any Server Vendor, Model, and Generation
- Monitor a wide range of hardware platforms, from legacy UNIX systems to modern GPU-accelerated servers.
- Collect OS and hardware metrics across vendors, models, and generations.
- Normalize vendor-specific metrics using OpenTelemetry naming conventions.
- Remove the need for multiple exporters and vendor-specific monitoring tools.


Deep Visibility into All Critical Components
- Monitor Linux, Windows, and UNIX key performance indicators, including processor, memory, and file system utilization, disk and network activity.
- Extend monitoring to specific processes, services, system logs, and more.
- Track the health of critical hardware components such as disks, RAID controllers, fans, power supplies, sensors, processors, memory modules, and network ports.
- Consolidate dashboarding and alerting across operating systems.

AI-Assisted Troubleshooting for Faster Resolution
MetricsHub enables easy AI integration with its MCP Server. M8B is the out-of-the box virtual assistant leveraging this capability with OpenAI.
When users report application performance issues:
- M8B determines whether the root cause originates from the network, hardware, operating system, or another component.
- M8B provides guidance to support issue resolution.
- M8B confirms that systems have returned to normal after corrective actions are applied.

Seamless Integration with Your Existing Observability Platform
- Expose the collected metrics into your existing observability platform through the embedded OpenTelemetry Collector.
- Understand the health of your IT infrastructure at a glance with our prebuilt dashboards.
- Receive alerts through your existing alerting systems, including Prometheus Alertmanager, Datadog Monitors, and others.

Energy Usage Reports - No PDUs Required
- Measure the energy usage of all your servers
- Consolidate energy and carbon emissions metrics per application, per data center, or across your entire infrastructure
- Identify the most energy-intensive systems to prioritize optimization efforts
- Track server temperature metrics to detect overheating risks and safely adjust data center ambient temperatures.

Real-World Example
Monitoring 6,000 Servers Across Multiple Vendors

Managing more than 6,000 bare-metal servers from three different vendors across dozens of data centers had become increasingly complex for this organization. Fragmented monitoring tools and inconsistent alerts slowed incident response, resulting in up to seven days of downtime per year.
MetricsHub helped the organization unify hardware monitoring across all vendors and gain real-time visibility and proactive alerting across critical hardware components.
As a result, the customer achieved a 70% increase in IT team productivity, dramatically reduced downtime, and faster issue resolution.
Read the full storyAdditional Resources
Hands-on Labs
You Need MetricsHub if You:
Need consistent monitoring across multiple server vendors, models, and generations.
Want to extend your observability platform with comprehensive server and hardware insights.
Prefer to rely on a single collection agent instead of multiple vendor-specific tools.
Need a consolidated and detailed energy usage and temperature reports.