Blog
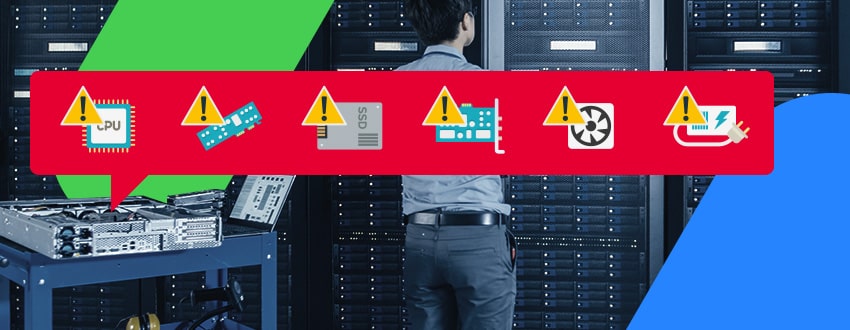
Oops, No Hardware Monitoring?
In the world of IT infrastructure monitoring, hardware monitoring is often the unsung hero. We monitor systems, databases, and applications, and implement extremely sophisticated solutions, only to realize we’ve overlooked something essential: hardware monitoring.
We need a solid understanding of our infrastructure, the very foundation everything else runs on. Monitoring hardware components is crucial for preventing system failures, improving performance, and ensuring uptime and resilience. Yet many teams still lack visibility in this area. Surprisingly, finding a solution for such a necessity can be challenging.
How neglecting hardware monitoring can hurt
The consequences of not implementing a hardware monitoring tool are numerous and varied:
- Increased downtime: Without real-time insights into hardware health (e.g., CPU temperature, or disk errors), issues can go unnoticed until they cause full system failures. This leads to service disruptions, SLA breaches, and loss of customer trust.
- Higher operational costs: Problems are often discovered too late, leading to emergency repairs or hardware replacements. Power inefficiencies and thermal issues (e.g., poor cooling, overuse) may go undetected, increasing utility bills.
- Delayed incident response: Without timely alerts, problems take longer to detect and diagnose. IT teams are reactive instead of proactive, increasing resolution times and the impact of failures.
- Reduced hardware lifespan: Overheating, excessive workload, or poor power management can wear down components faster; this shortens the lifecycle of expensive infrastructure.
- Inefficient resource utilization: Without proper monitoring, it’s difficult to optimize workloads across servers, leading to underused or overburdened hardware. Scaling decisions are made blindly, possibly causing waste or performance bottlenecks.
So how can we avoid all these pitfalls?
MetricsHub® fills the gaps in hardware monitoring
That’s where MetricsHub® comes in. Built by specialists with over 20 years of hardware monitoring expertise, this modern solution features a unique, continuously enriched multi-vendor knowledge library. MetricsHub® supports the latest and older-generation devices from vendors like HPE, Dell EMC, IBM, NetApp, Lenovo, Pure, Huawei, and more. It interacts with these systems using a wide range of protocols and methods, including HTTP, IPMI, PING, SNMP, SSH, WBEM, WinRM, and WMI.
Among many other features, MetricsHub® offers:
-
Extensive hardware coverage: Whether managing the latest enterprise storage arrays or keeping legacy servers alive under extended support contracts, MetricsHub® ensures comprehensive visibility across the entire hardware fleet. Its broad compatibility eliminates blind spots and keeps every critical component in check.
-
Deep hardware insight: MetricsHub® keeps a close eye on the heartbeat of hardware, monitoring everything from physical disks and network adapters to fans, power supplies, and temperature sensors. This level of insight goes beyond just detecting failures; it helps make smarter operational decisions. For example, by collecting temperature metrics from infrastructure components, MetricsHub® helps confidently adjust cooling settings, making data centers more efficient both environmentally and financially. It helps avoid the common (and costly) mistake of keeping data centers colder than necessary, which drives up energy costs and brings no real benefit.
-
Real-time detection: By identifying early warning signs of hardware degradation, MetricsHub® helps act before a minor issue turns into a major outage. For example, relying on a solution like MetricsHub® can help decrease downtime from 948 hours across 1,000 servers to 46 hours (see How Much Do Hardware Failures Really Impact Your Uptime? for more details).
-
Seamless integration: Built on OpenTelemetry, MetricsHub® integrates with popular observability platforms. Already using Prometheus, Datadog or Splunk? No problem. MetricsHub® slots right into the existing observability stack, feeding hardware metrics directly into available dashboards. No need to reinvent the monitoring strategy, just make it stronger.

Example of Grafana dashboard based on MetricsHub®

Example of Grafana dashboard based on MetricsHub®
-
One agent, many servers: A single agent can monitor hundreds of servers, eliminating the hassle of deploying and maintaining local agents on every server. This scalable approach saves time, reduces overhead, and gets monitoring up and running faster. Deployment is no longer a headache with MetricsHub®.
How MetricsHub® works
MetricsHub® is a universal metrics collection solution for OpenTelemetry. It extracts metrics from any local or remote resource - such as a host, service, or application - and pushes the collected data to any observability back-end supporting OpenTelemetry such as Prometheus, New Relic, ServiceNow, and Splunk. It acts as an agent within the infrastructure, pulling data from systems and applications using various protocols like SNMP, WMI, REST APIs, or SSH.

MetricsHub® Operating Principle
Icing on the cake
And that’s not all, MetricsHub® goes far beyond hardware monitoring. It supports sustainability initiatives by tracking electricity usage and carbon footprint, helping optimize energy consumption and improve data center efficiency.
By integrating sustainability into IT monitoring, MetricsHub® helps implement green IT initiatives without compromising operational performance.
We’ll explore these green IT initiatives in an upcoming article. Stay tuned!
No more blind spots with MetricsHub®
MetricsHub® is the missing piece in any IT monitoring strategy, a powerful, vendor-agnostic hardware monitoring solution that integrates effortlessly with modern observability platforms. Whether you’re managing cutting-edge infrastructure or keeping legacy systems alive, MetricsHub® has you covered.
If you’re a managed services provider (MSP), responsible for hardware monitoring in your organization, or simply want your IT team to operate with greater confidence, MetricsHub® is made for you.
See MetricsHub® in action: Explore our live demo site and discover how easy it is to bring on-prem observability to your existing monitoring platform.