MetricsHub® Community Edition
Visibility into IT Infrastructure for Free
Infrastructure monitoring is essential to reliability, but too often reserved for those who can afford complex, proprietary tools, leaving many teams without the visibility they need.
MetricsHub Community is a free and open-source metrics collector designed to provide essential infrastructure metrics in OpenTelemetry format, for teams and projects of any size.
Open source. Free. Infrastructure Monitoring.
Explore Monitoring Coverage Talk to an Expert
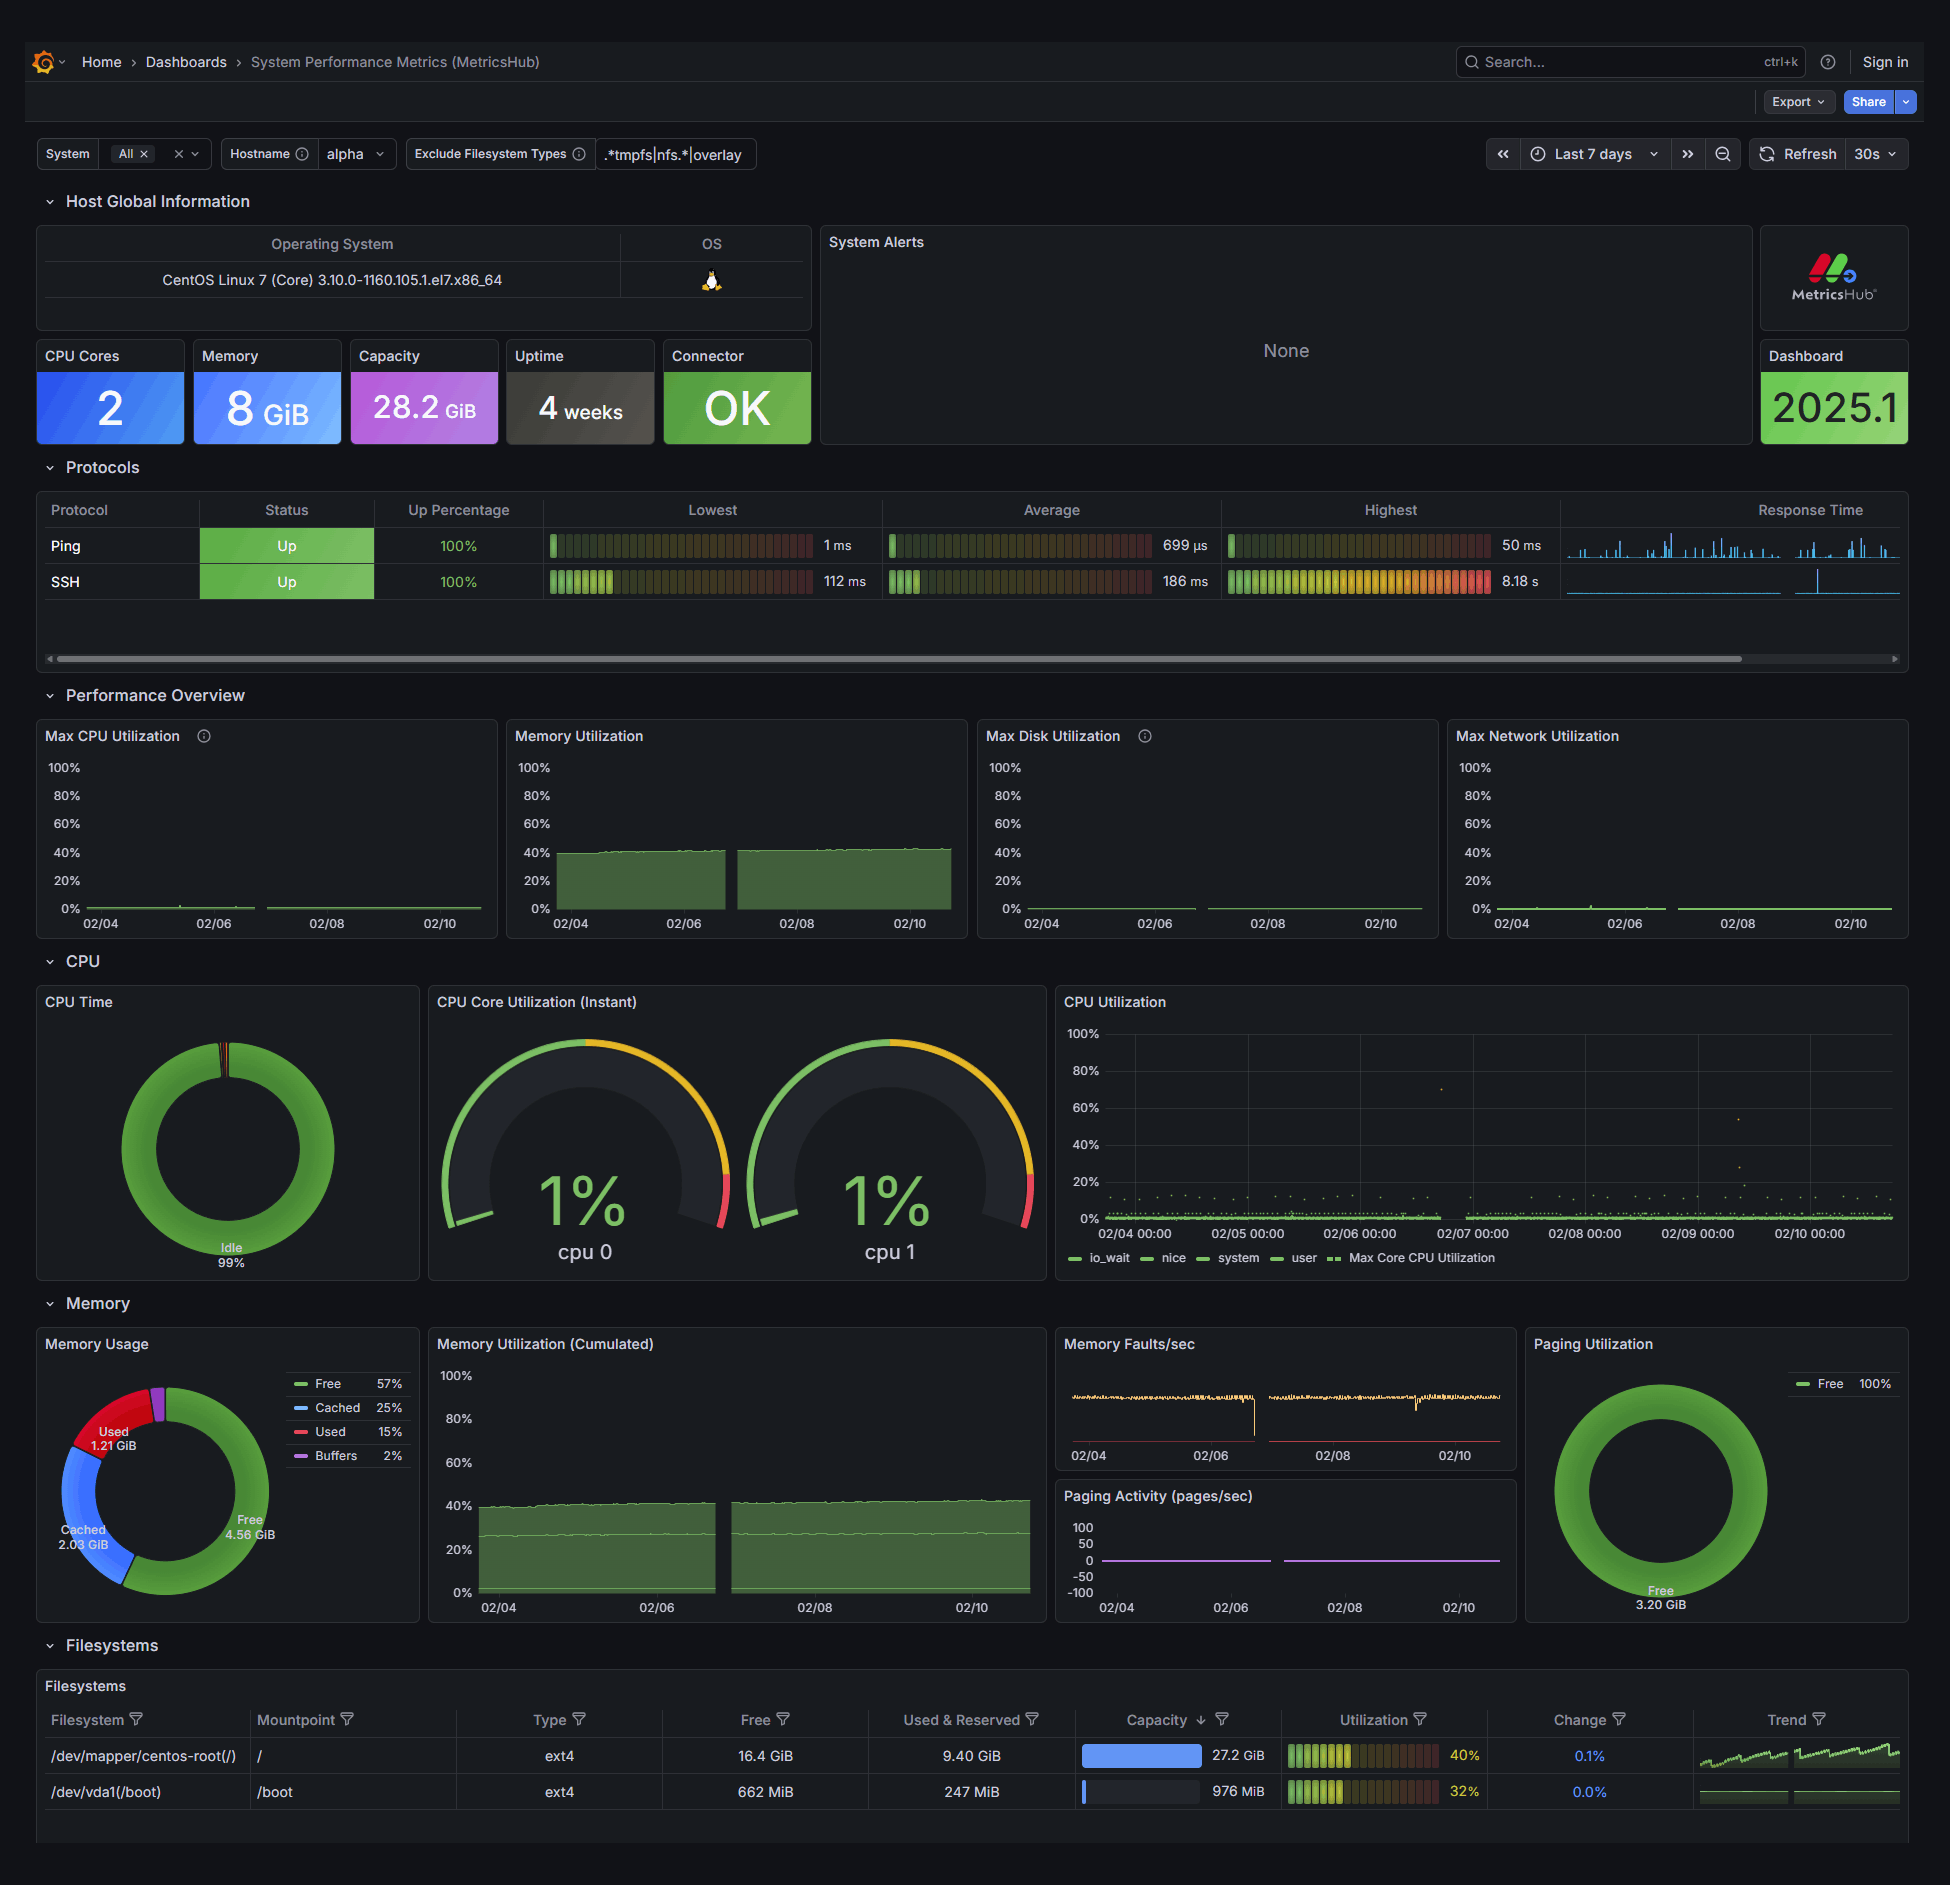
Remotely Track the Health of Thousands of Linux and Windows Servers
Collect metrics to understand system behavior and detect issues before they impact applications.
- Streamline setup, maintenance, and upgrades: Use one MetricsHub instance to remotely monitor up to 1,000 Linux and Windows servers.
- Easy querying, dashboarding, and correlation with OpenTelemetry-normalized metrics for CPU, memory, disk, filesystem, and network.
- Extend monitoring to processes, services, files, HTTP endpoints, SNMP devices, WMI resources, JMX metrics, and more.
- Monitor essential server health indicators such as power supplies, disks, batteries, and sensors using Redfish, SNMP, and IPMI.
Need enterprise-grade metrics?
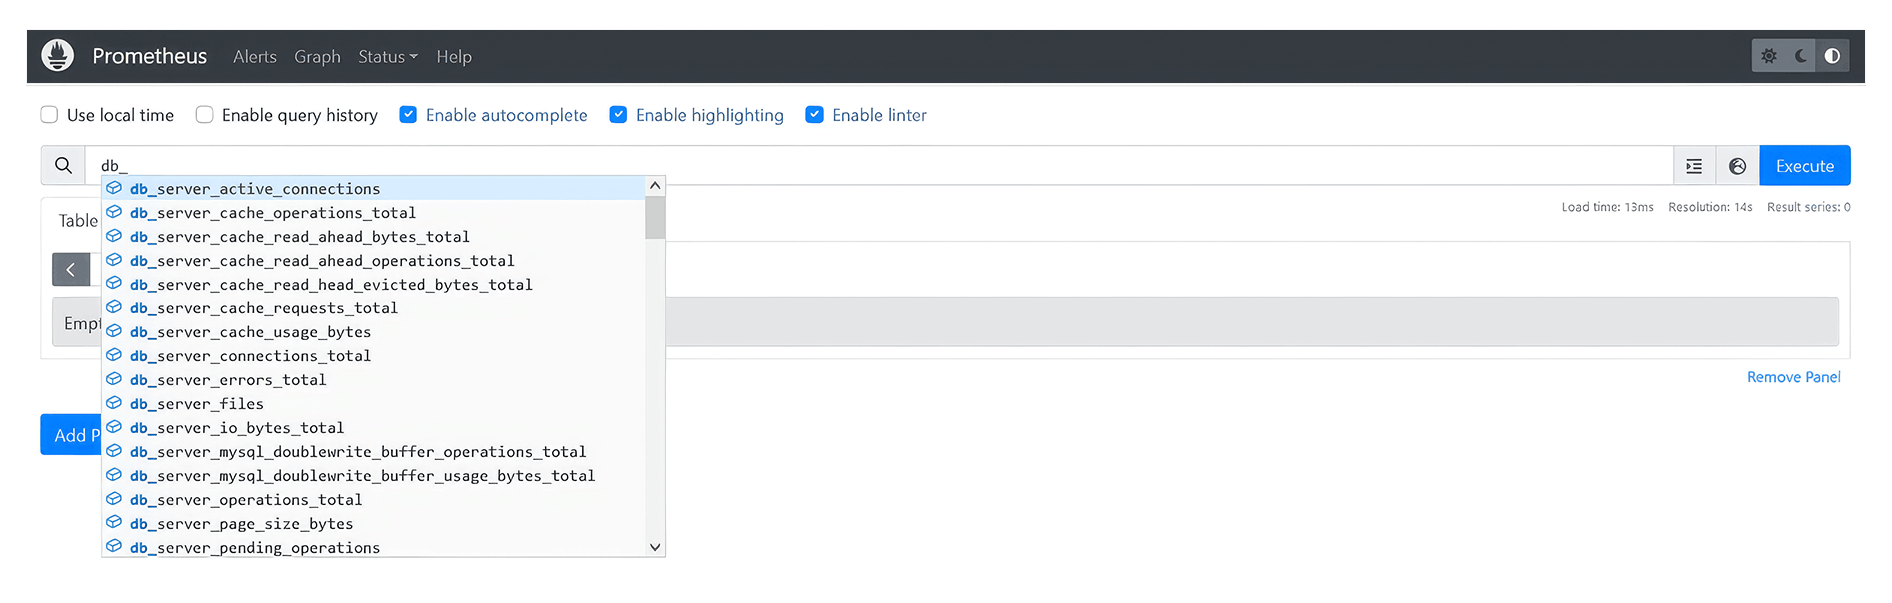
Troubleshoot Database Performance
Detect common issues affecting your databases before they impact applications.
- Identify performance bottlenecks: I/O, cache, table performance, slow queries, etc.
- Improve database reliability and availability: Track connection usage, timeout errors, and basic health indicators to detect availability issues.
- Understand database load and usage patterns: Analyze read and write activity, thread usage, pending operations, and storage growth.


Need broader database coverage?
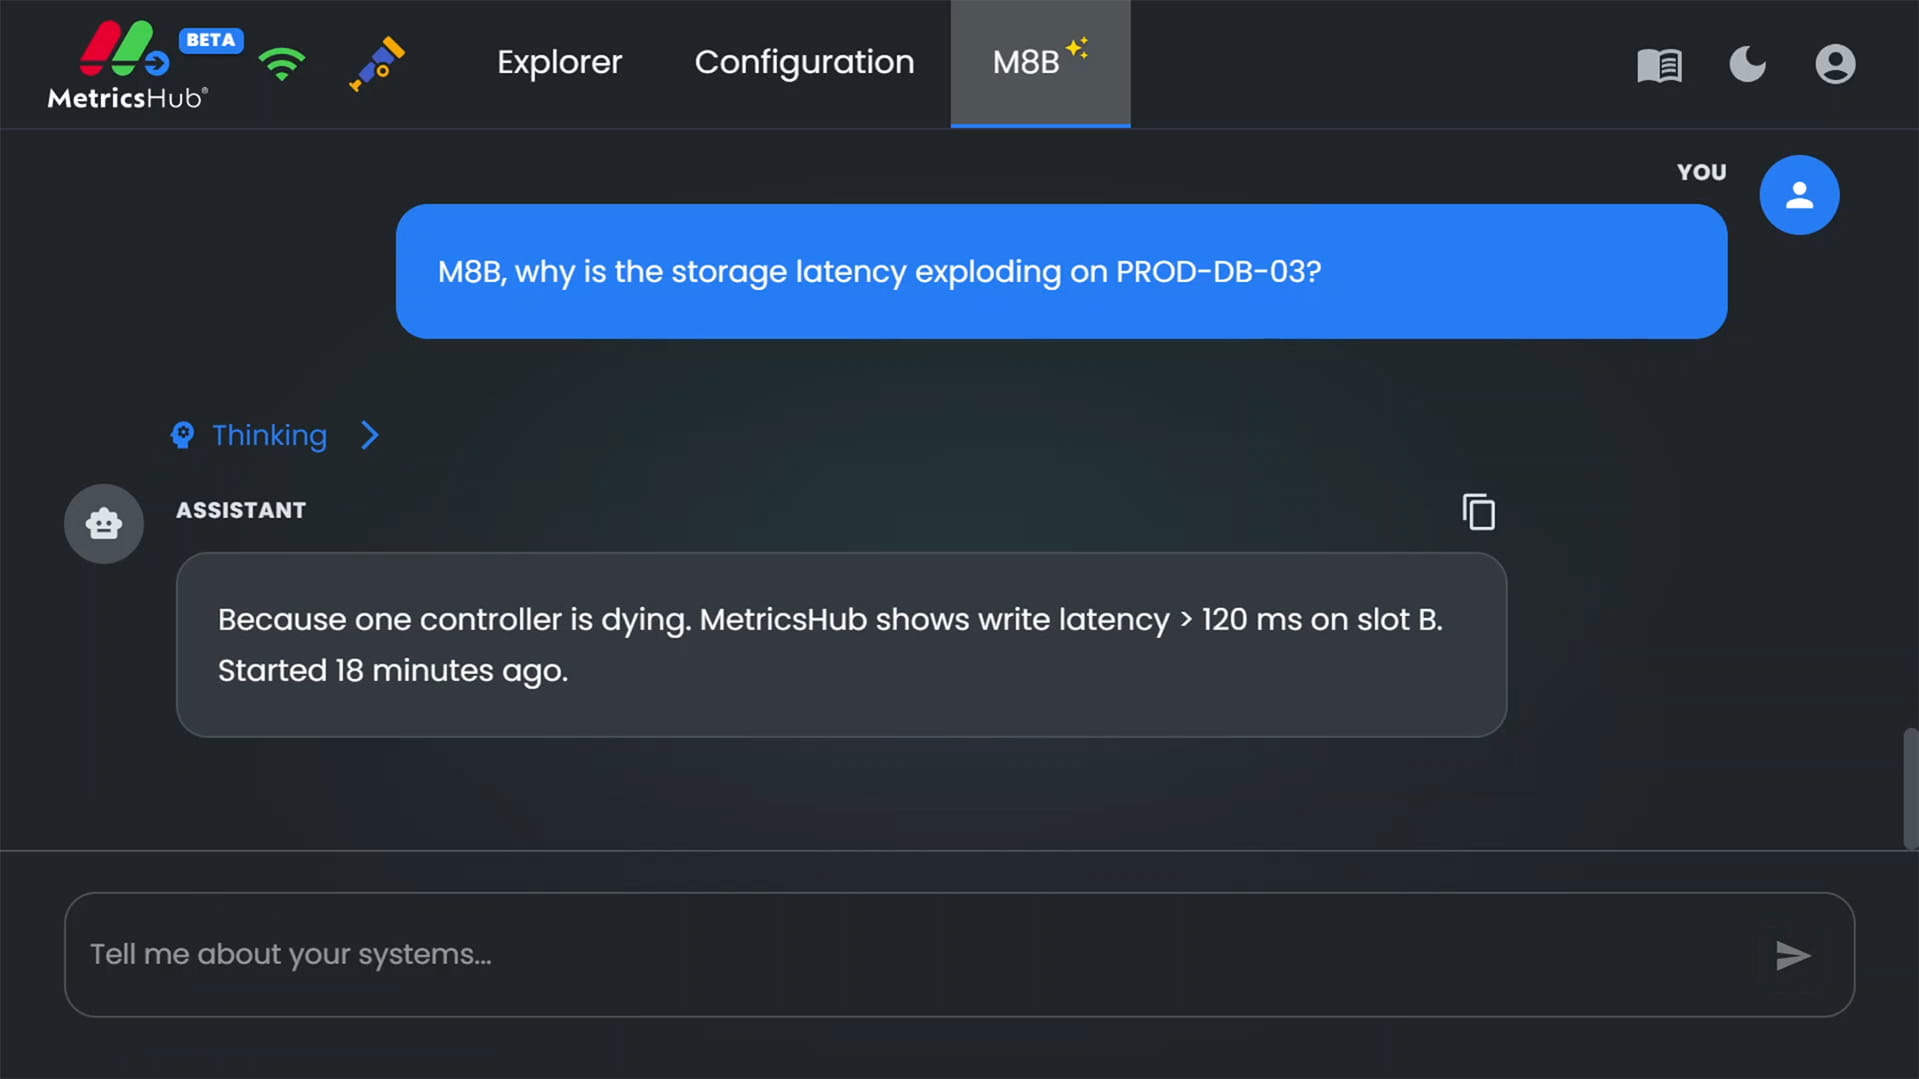
Use AI to Support Your Day-to-Day Operations
MetricsHub extends beyond metrics collection by supporting AI-assisted operations through M8B.
- AI-ready by design: MetricsHub allows LLMs to gather infrastructure metrics live through its MCP Server.
- Interact live with M8B: Ask M8B questions about monitored servers and applications, and let it surface the most relevant metrics and context for faster troubleshooting.
- Resolve incidents faster: Spend less time validating facts, correlating metrics, and isolating root causes. M8B helps surface relevant facts quickly, supporting faster diagnosis and decision-making.
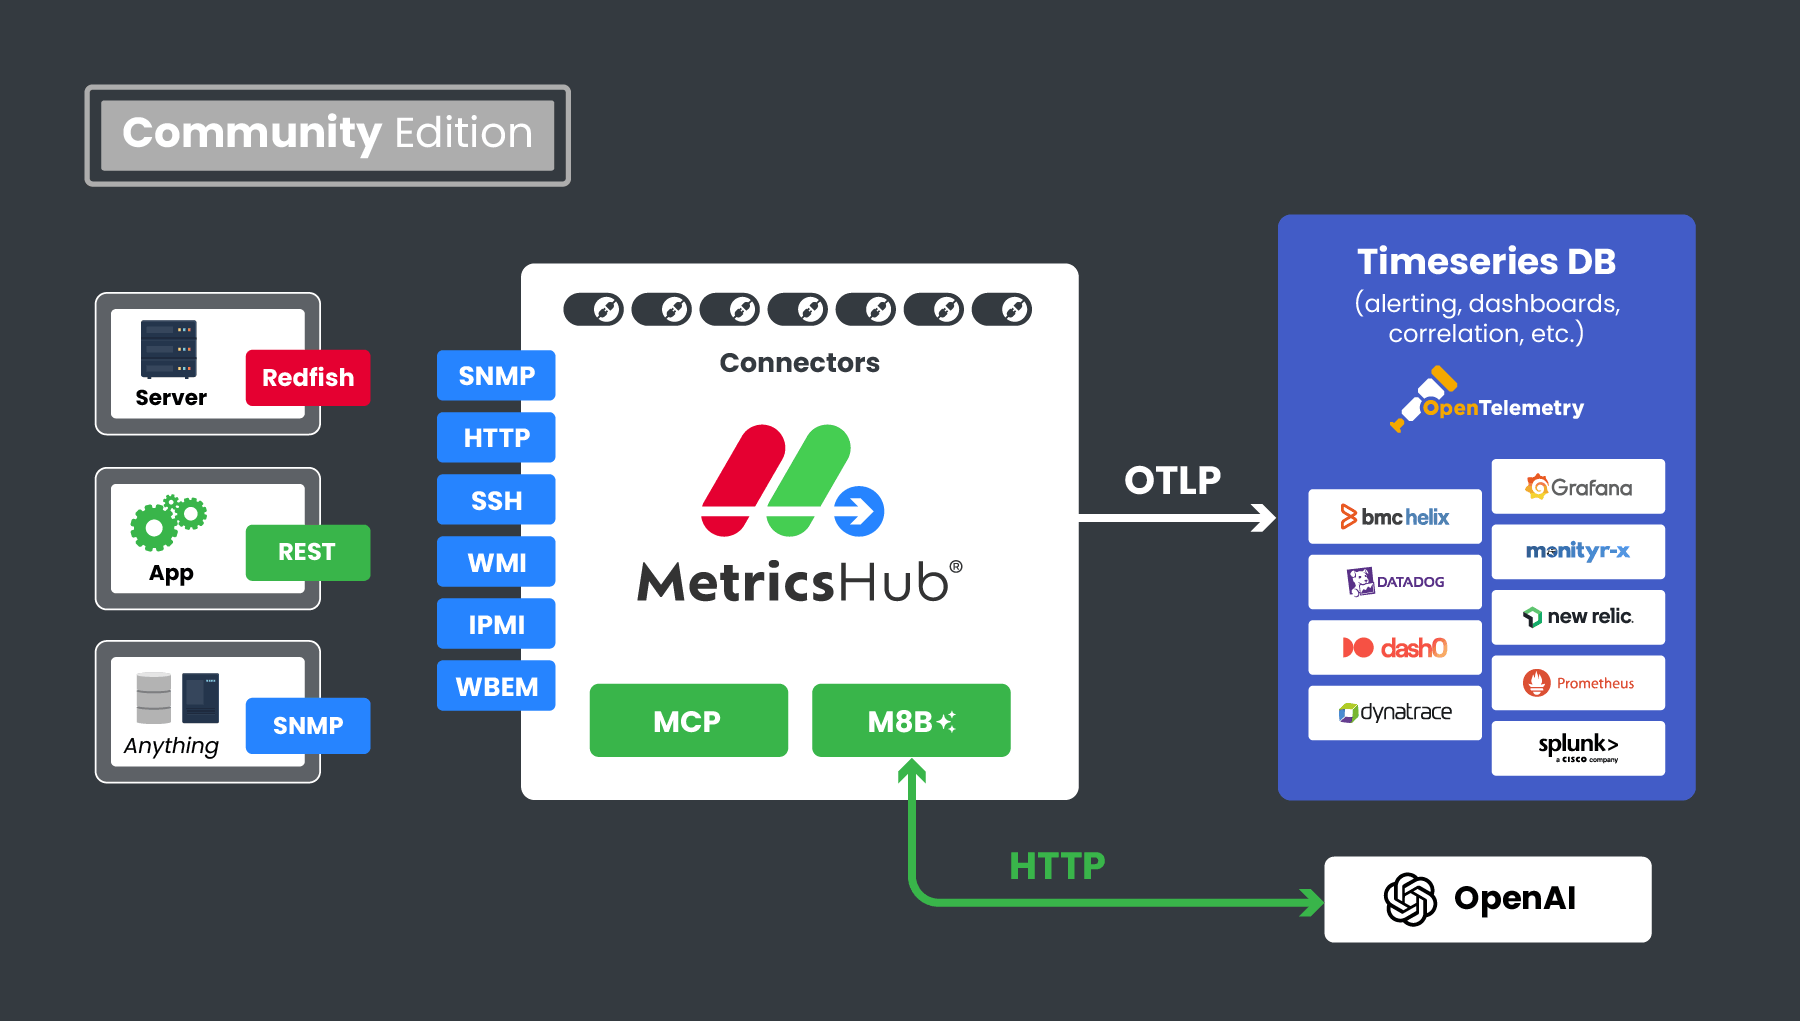
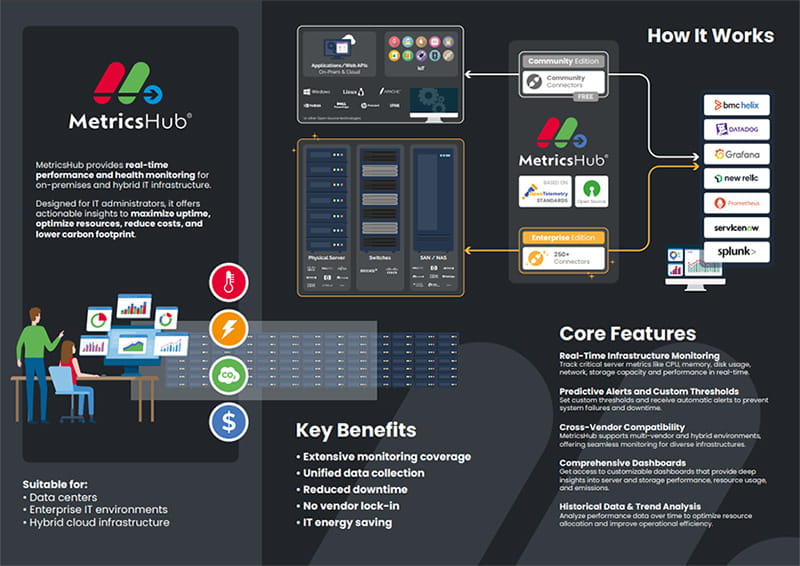
How MetricsHub Community Works
MetricsHub Community is a collection agent running in your infrastructure network. It extracts telemetry from your servers, storage systems, and network devices. Metrics are collected using protocols like SNMP, SSH, Redfish, IPMI, JMX, SQL/JDBC, WMI, WinRM.
Telemetry is sent to your observability back-end (Prometheus, Datadog, New Relic, Splunk, and more) using the OpenTelemetry protocol (OTLP).
MetricsHub Community also exposes the collected metrics to any LLM (Claude, OpenAI, Gemini, etc.) through its MCP Server.
Additional Resources
MetricsHub Brochure
PDF (3.29 MB)- [Blog] Exploring the Landscape of Observability: OpenTelemetry, MetricsHub, and More
- [Blog] Unlocking Innovation: Why MetricsHub Embraced Open Source
- [Blog] Building MetricsHub Community from Source
- [Blog] How Many Systems Can a Single MetricsHub Agent Monitor?
- [Blog] How Much Do Hardware Failures Really Impact Your Uptime?
- [Blog] MetricsHub Achieves 15% Electricity Savings in Data Center through Temperature Optimization
- [Blog] Auto-Provisioning of the Monitoring with BMC Helix
- [Docs] Quick start guide for operating MetricsHub Community Edition and Prometheus
FAQ

MetricsHub Enterprise builds on this foundation with expanded hardware, storage, and database metrics to support larger or more complex environments.