Maximize Uptime & Efficiency
Stay ahead in the AI race—MetricsHub powers proactive observability for your on-prem infrastructure, ready for the OpenTelemetry era.

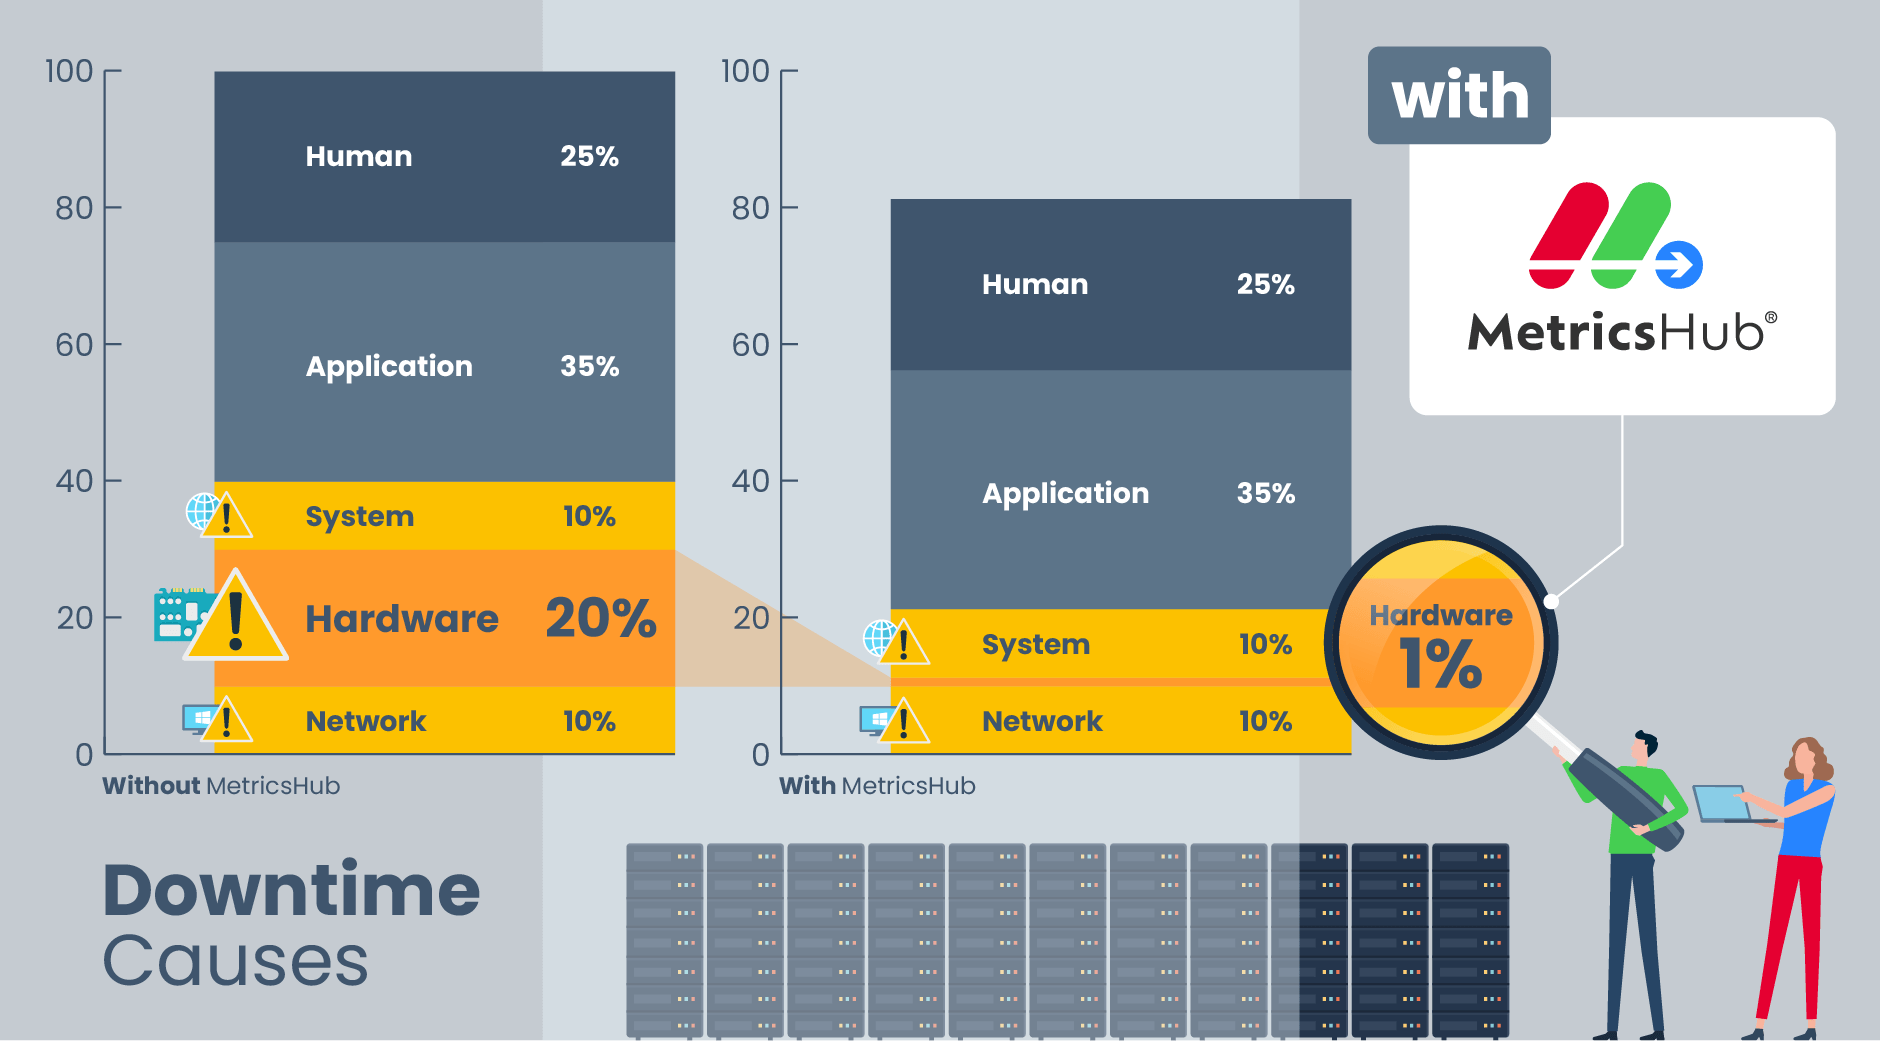
40% of downtime is driven by infrastructure failures
Electronic components have a fixed lifespan—it's not a matter of if they'll fail, but when.
Numbers don't lie. Take a lookSimplify IT Infrastructure Observability
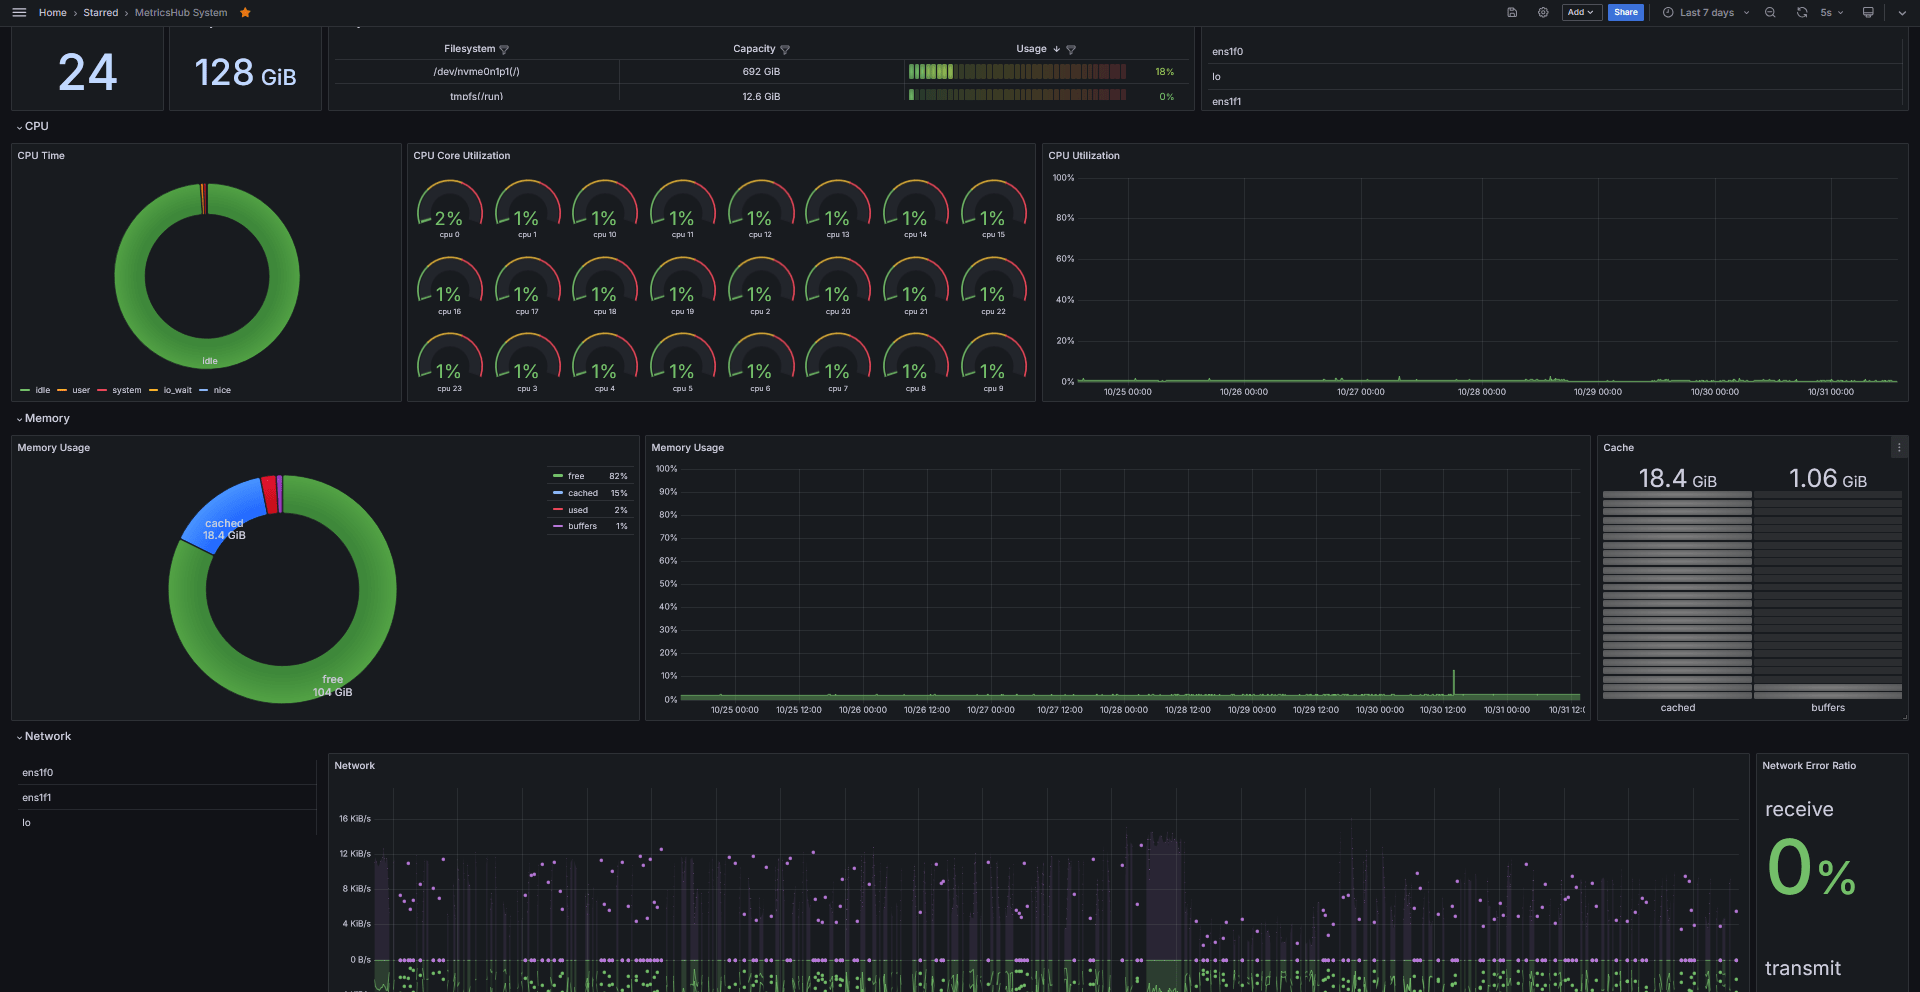
Standardize metrics collection across distributed systems and teams
Achieve unmatched scalability with one agent for data collection and transmission
Seamlessly expose telemetry signals to one or multiple observability backends


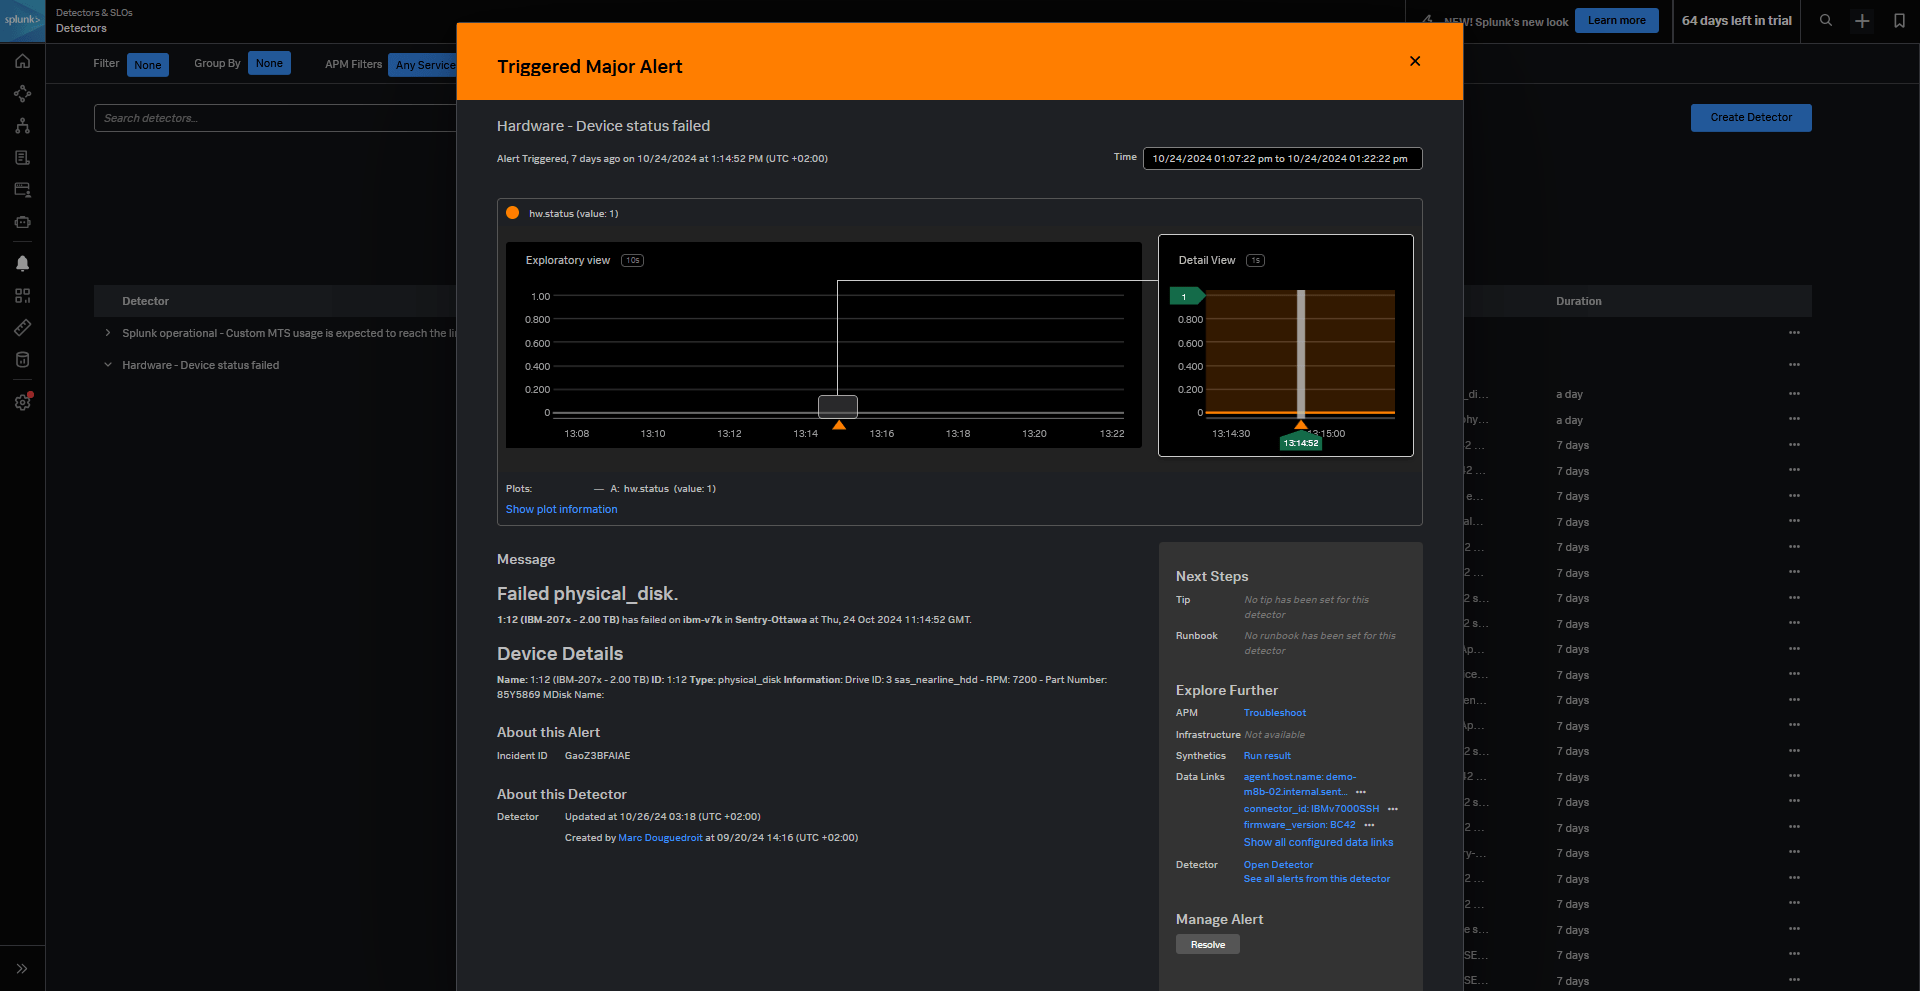
How a Leading Telco Achieved Unified Observability in Just 5 Months
Managing 6,000+ servers across multiple vendors was a challenge—fragmented tools, delayed alerts, and operational inefficiencies put service quality at risk.
MetricsHub® changed the game.
Harness the Power of Open-Source Collaboration with MetricsHub®
- Use Community Connectors for essential hardware and systems monitoring
- Extend observability by developing custom connectors to meet unique needs
- Collaborate with a passionate developer community to enhance your monitoring capabilities
- Shape the future of MetricsHub® and make a lasting impact on infrastructure observability

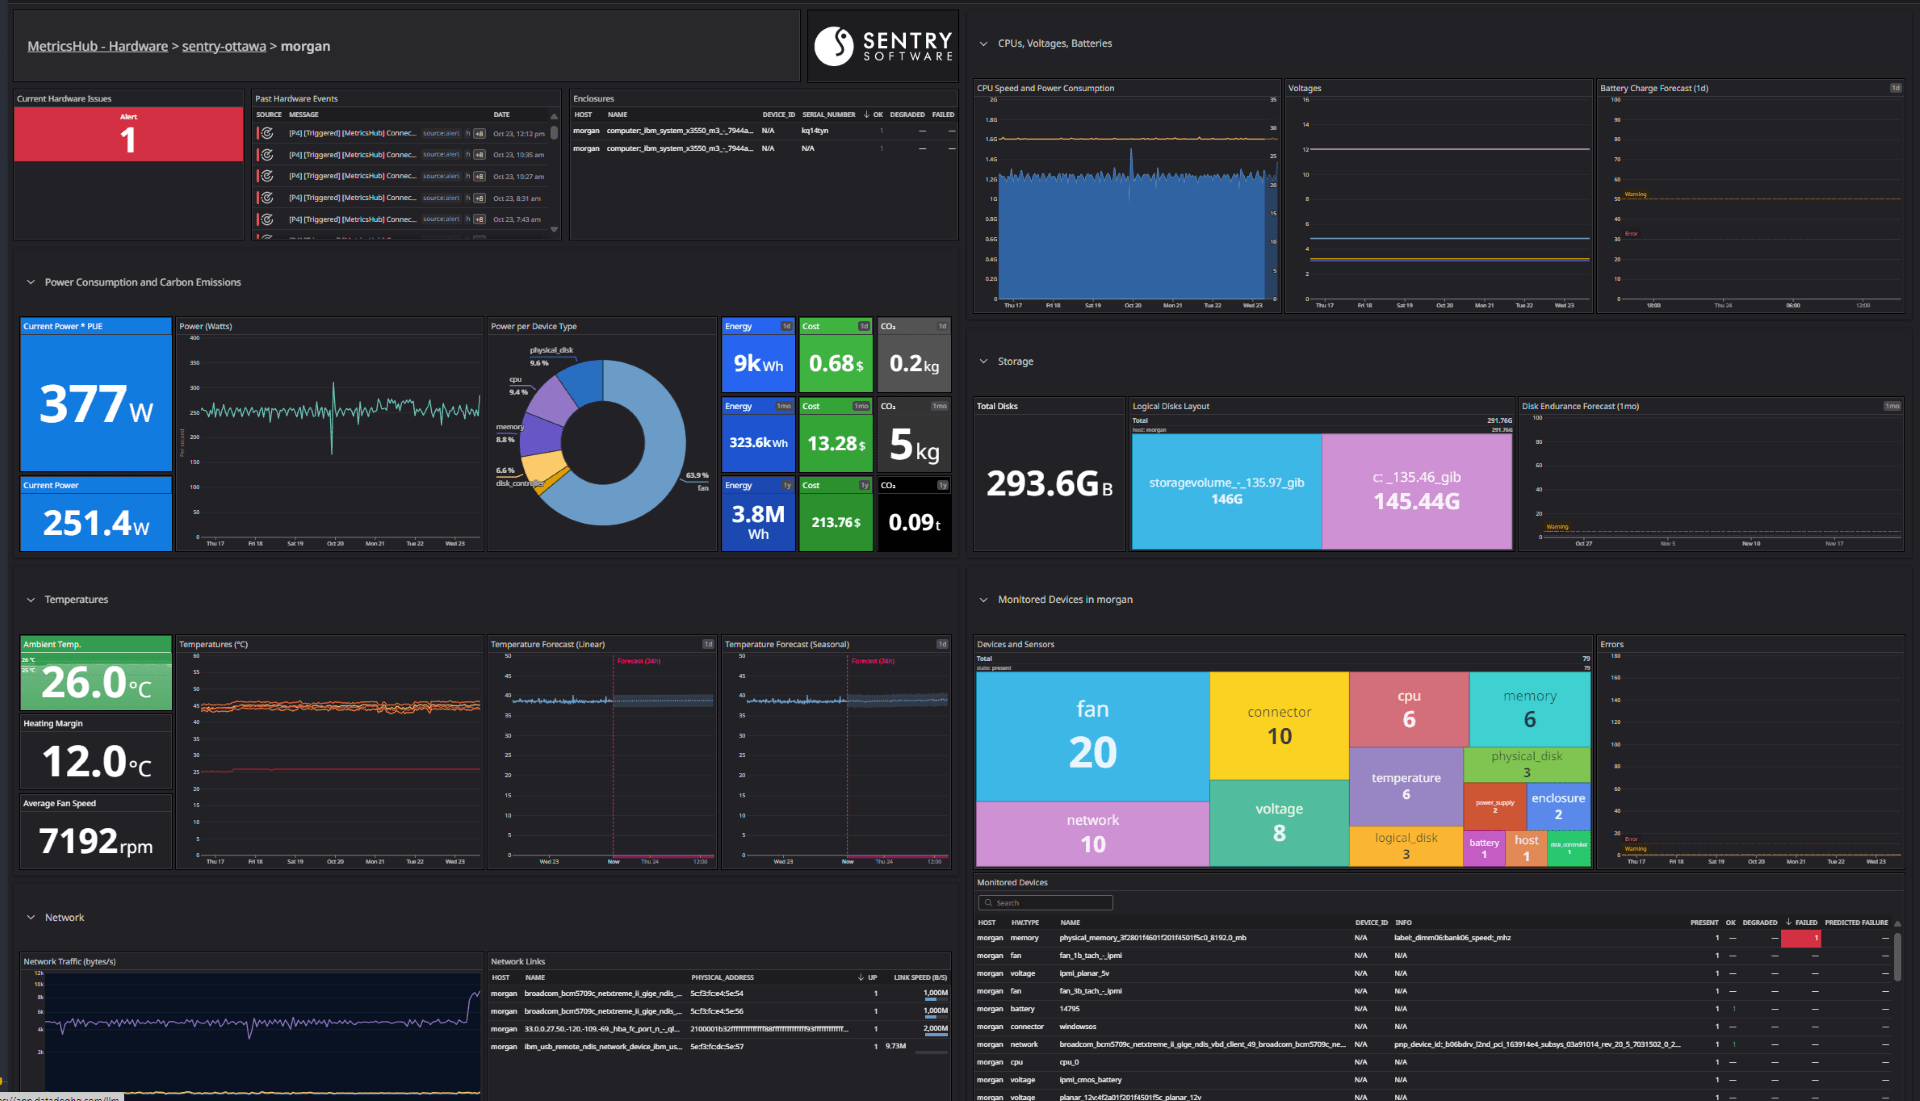
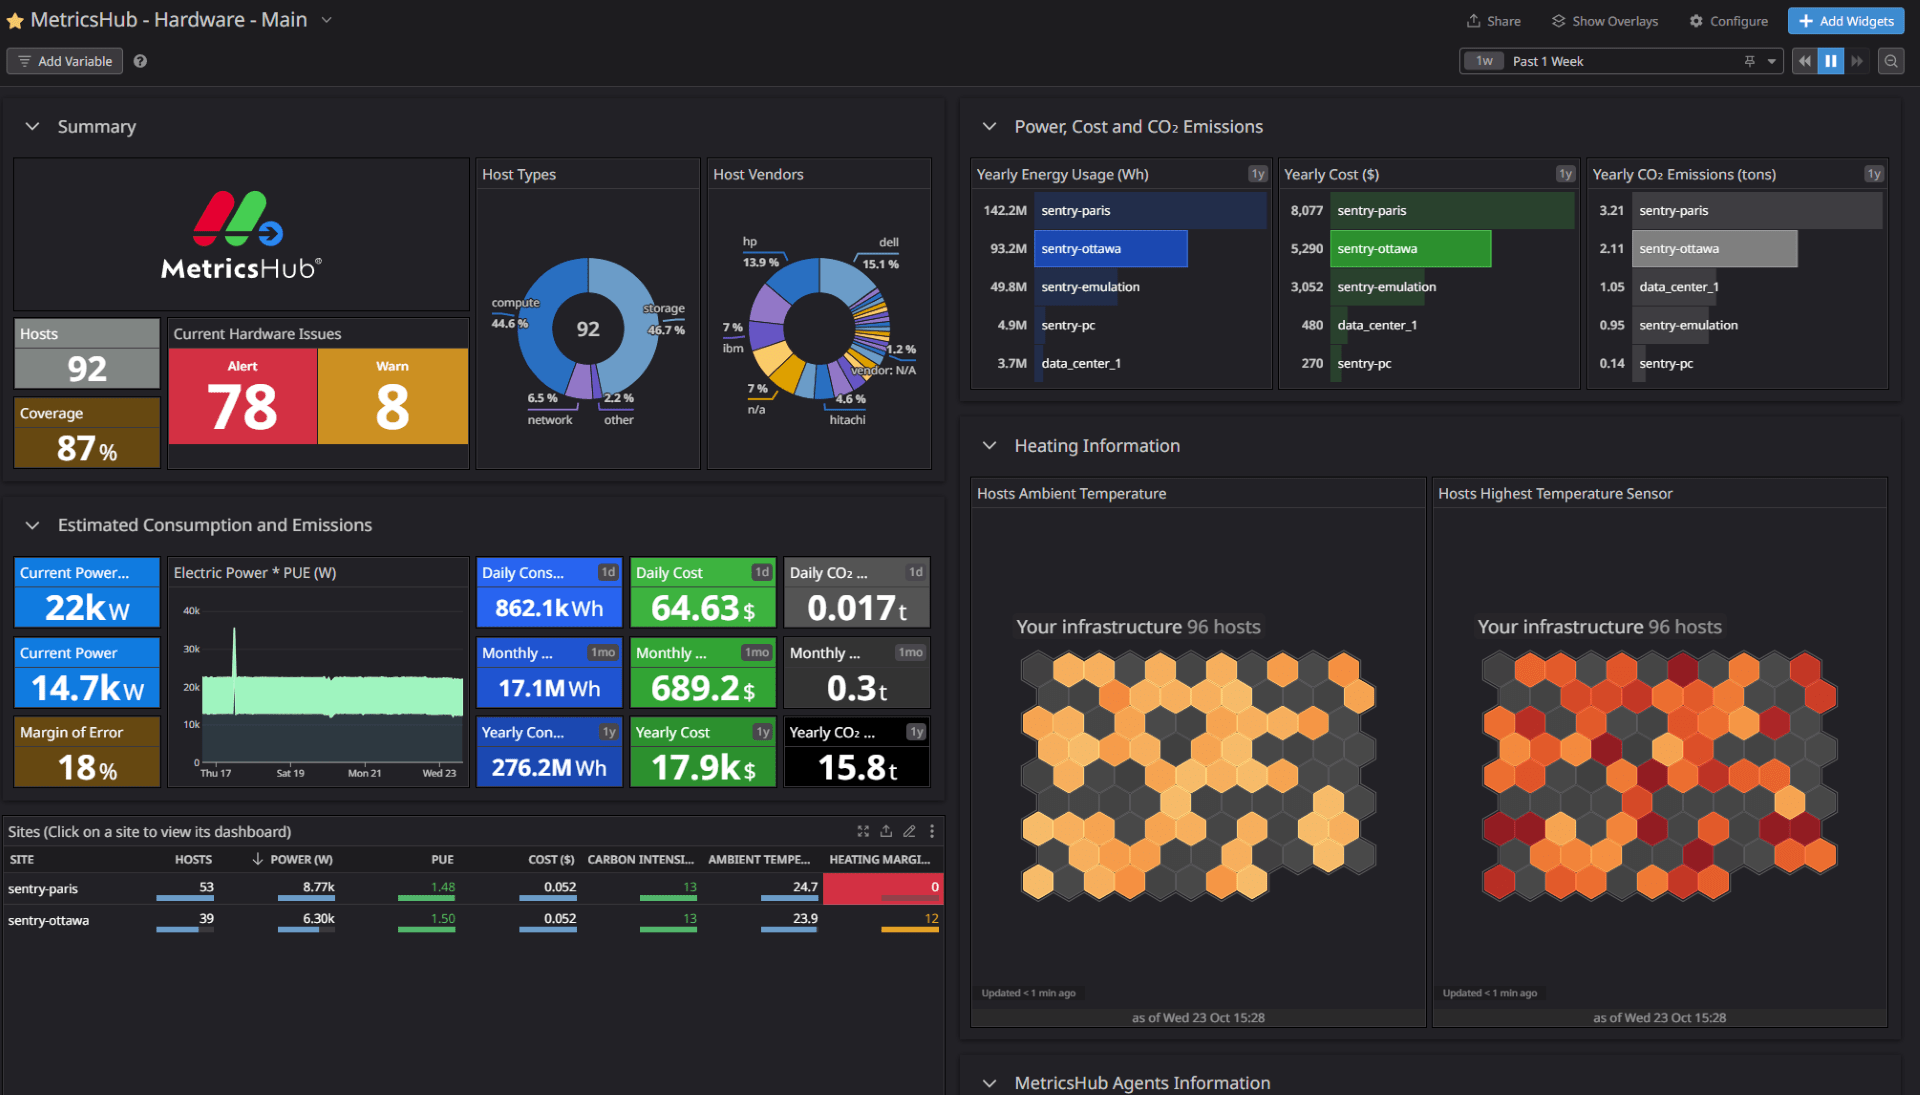
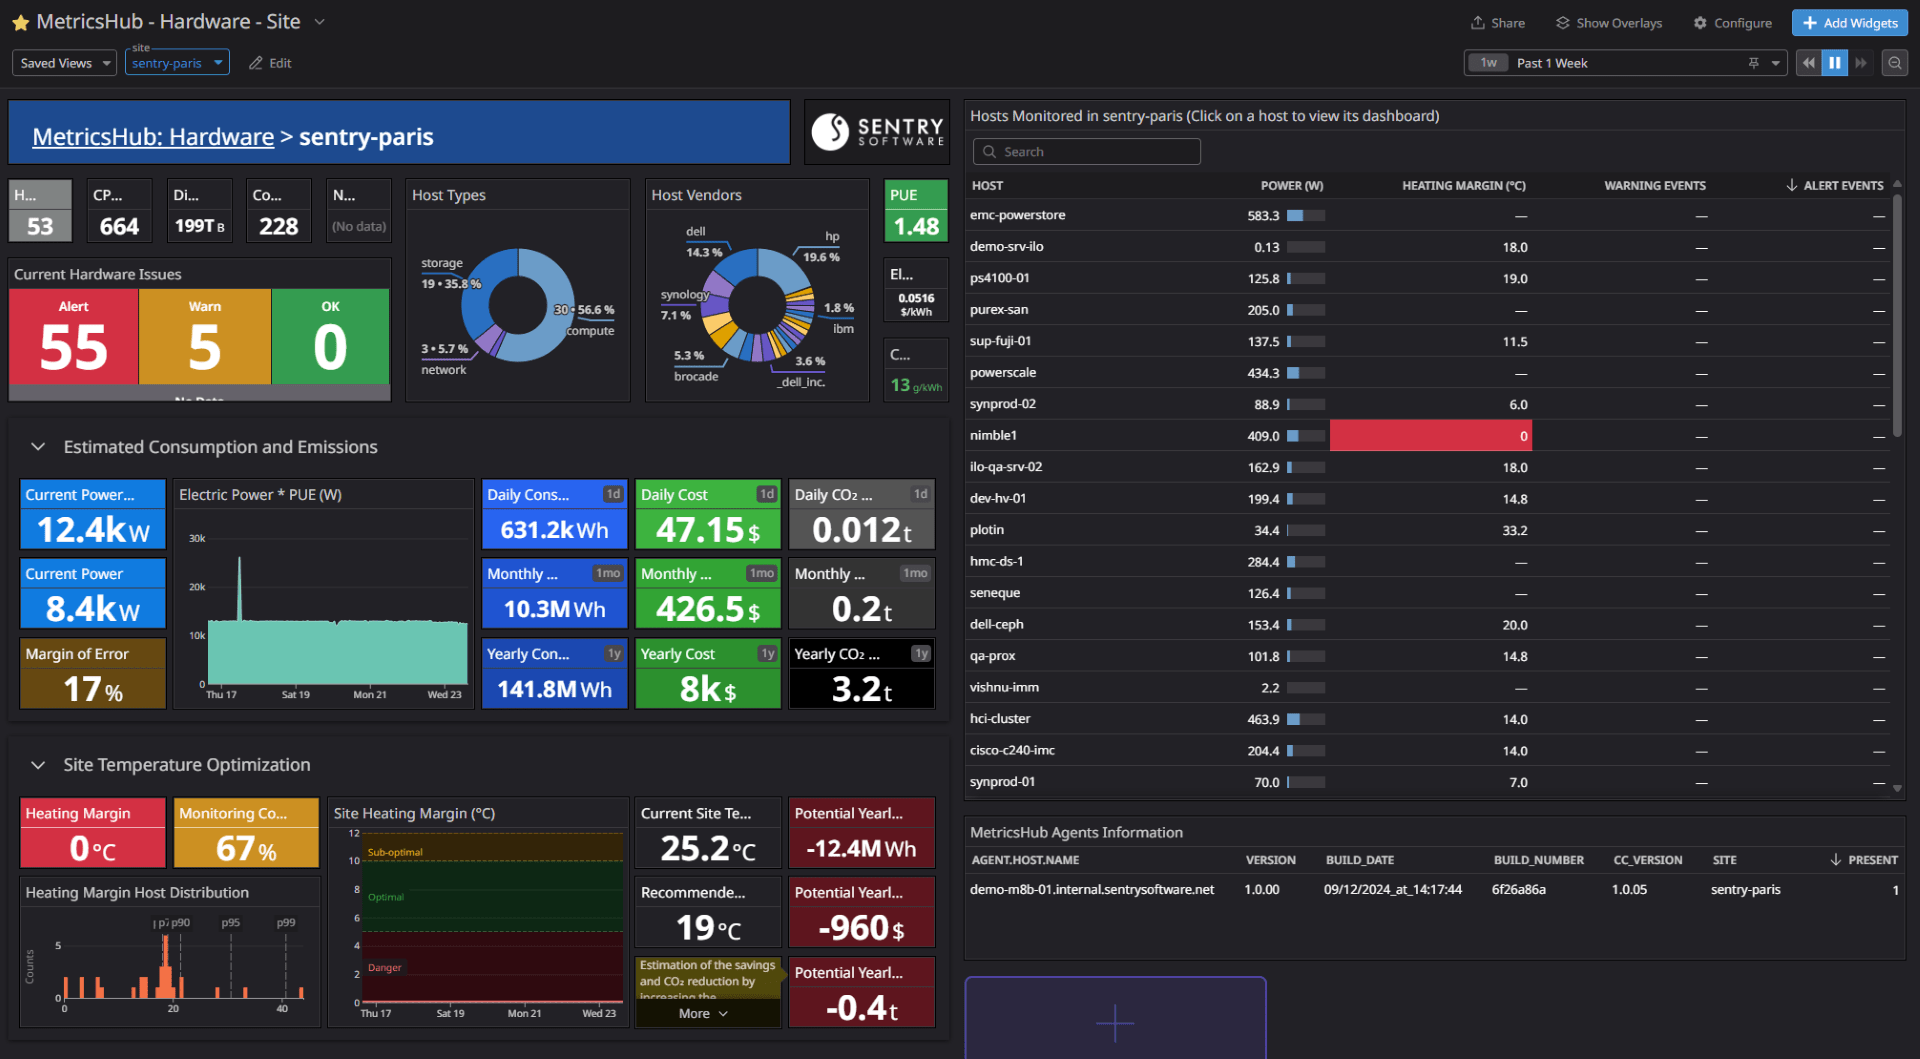
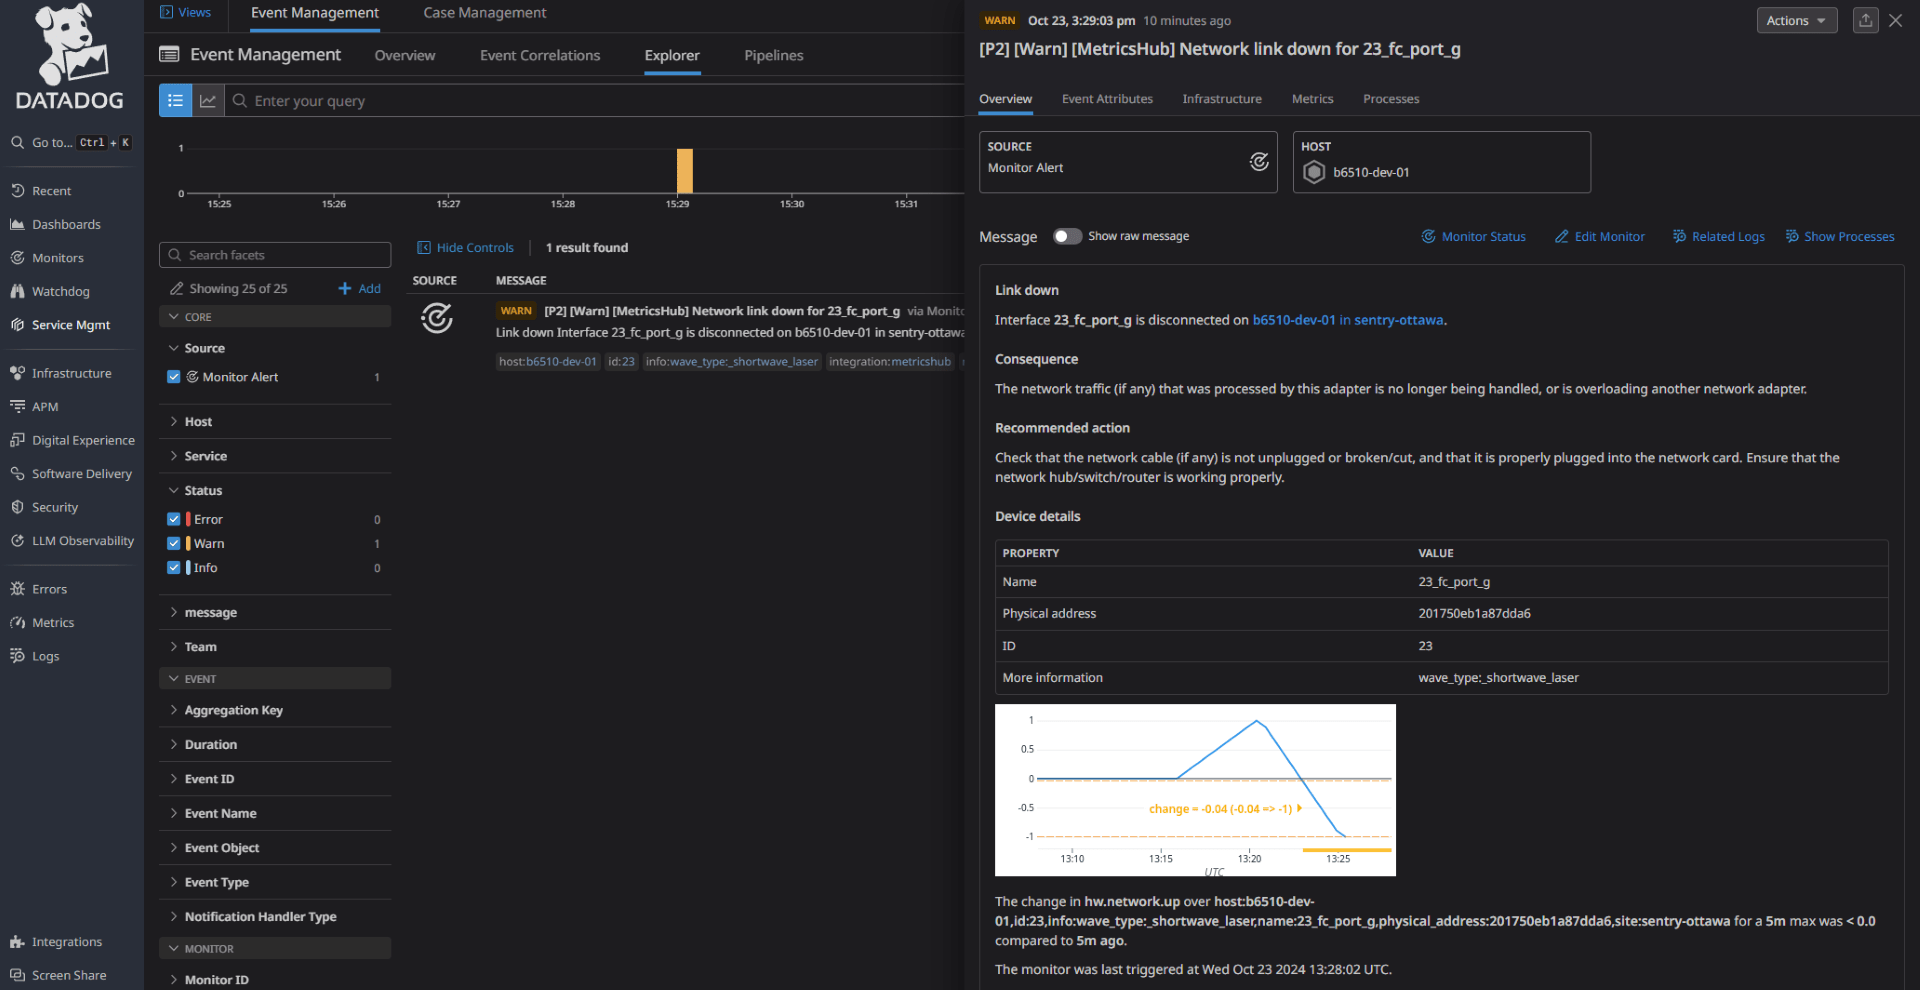
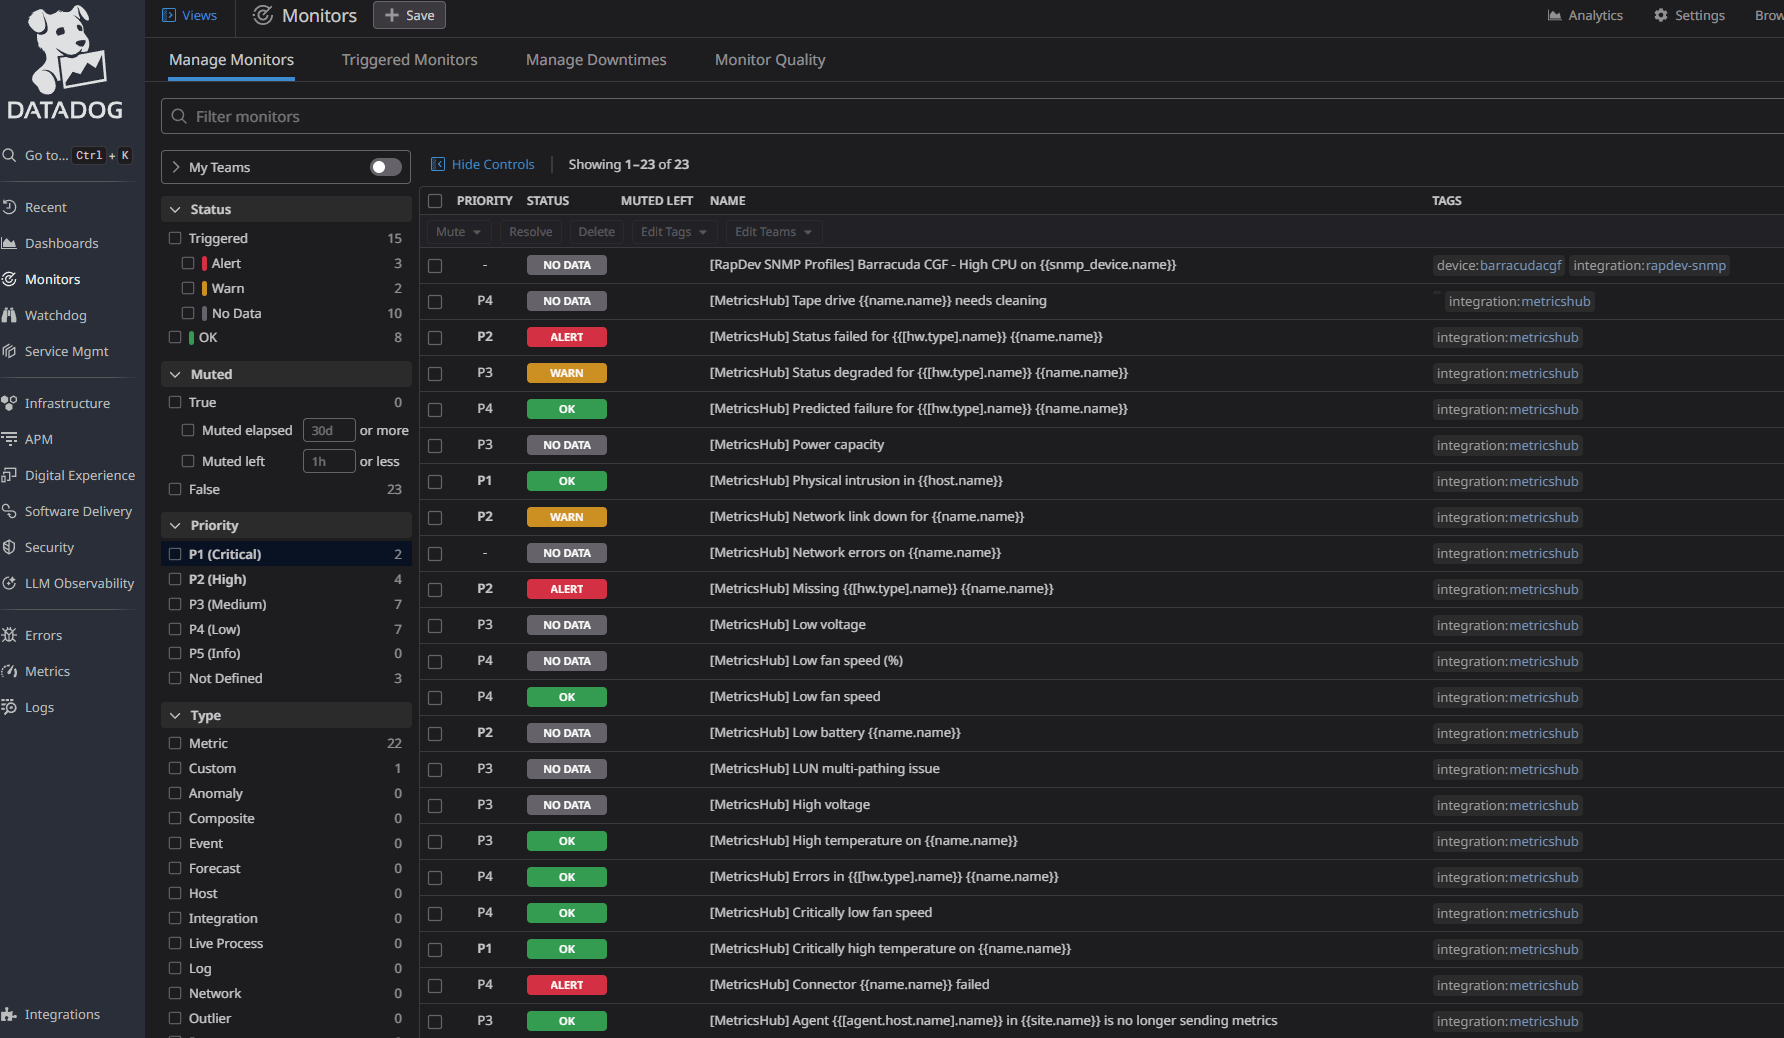
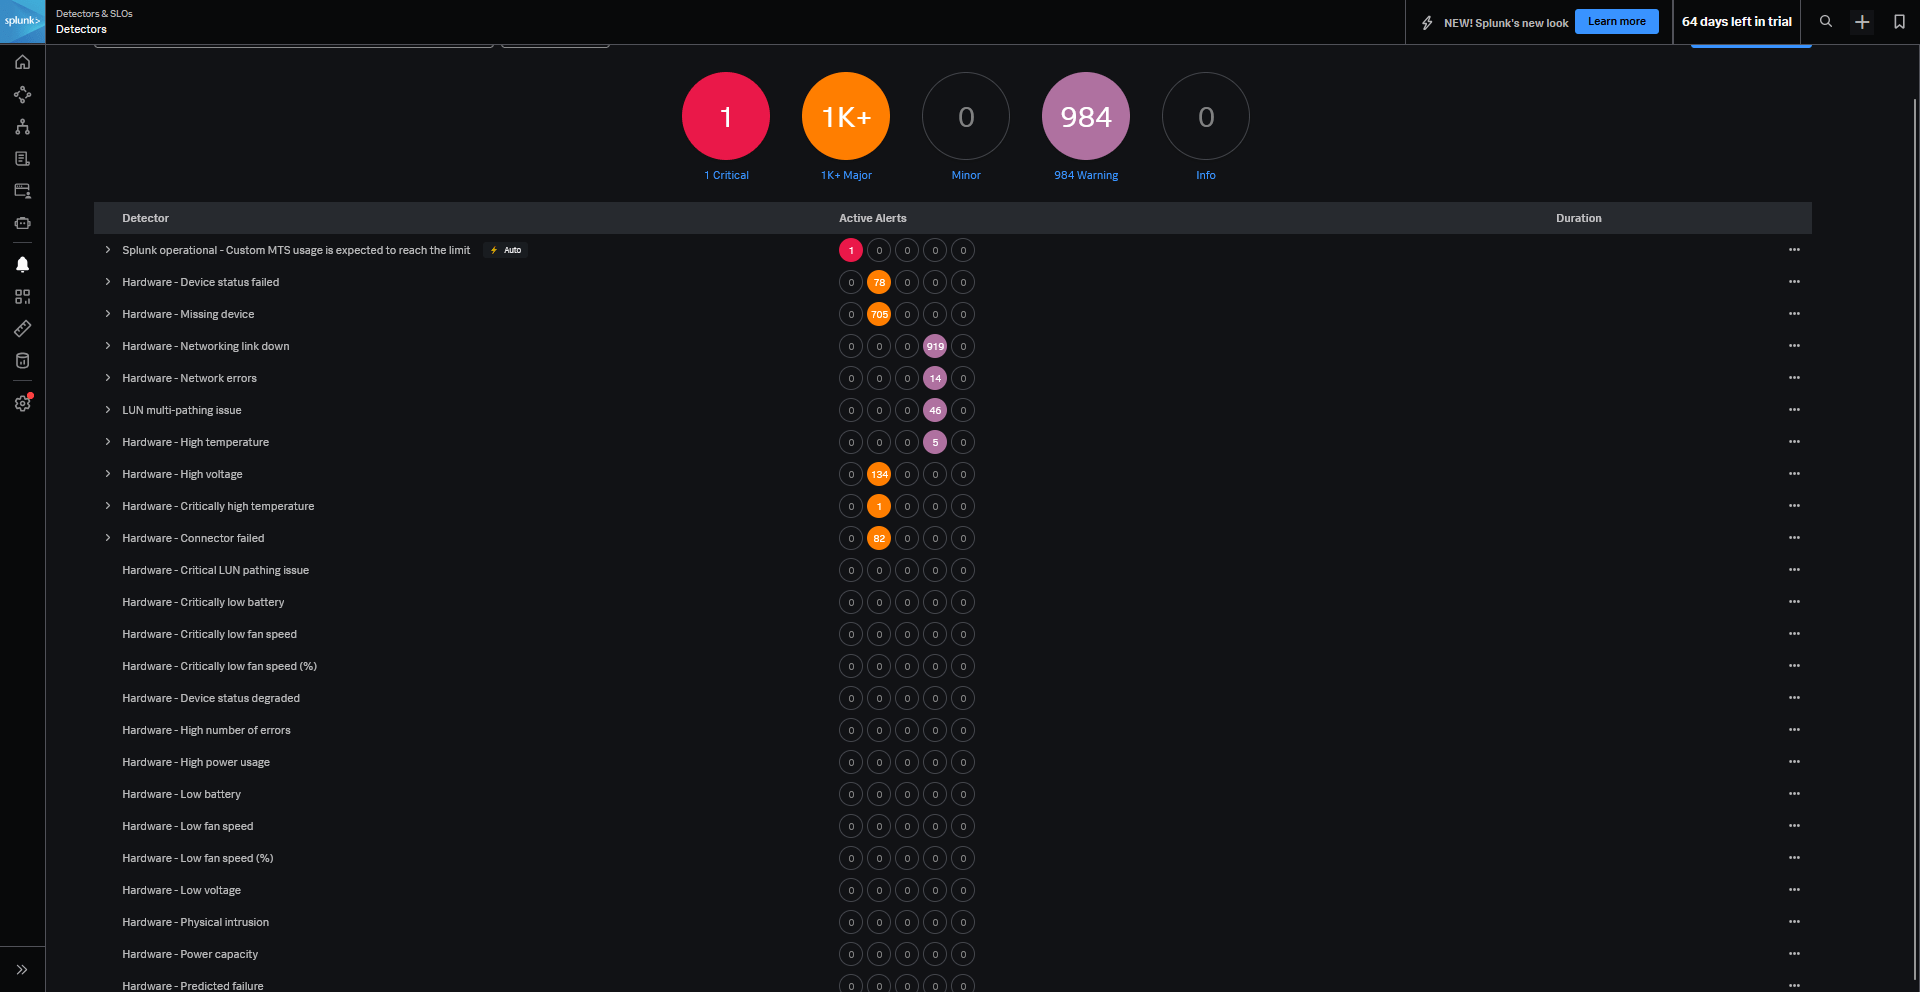
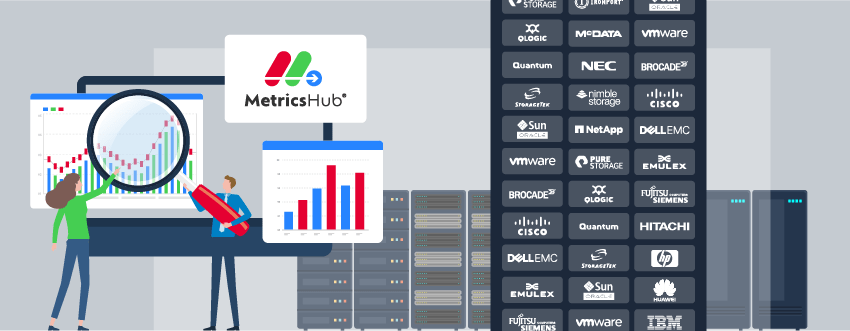
Ensure Maximum Observability Coverage
Out-of-the box support for 100+ platforms and custom monitoring through SNMP, HTTP, IPMI, WMI, and more.
Explore all


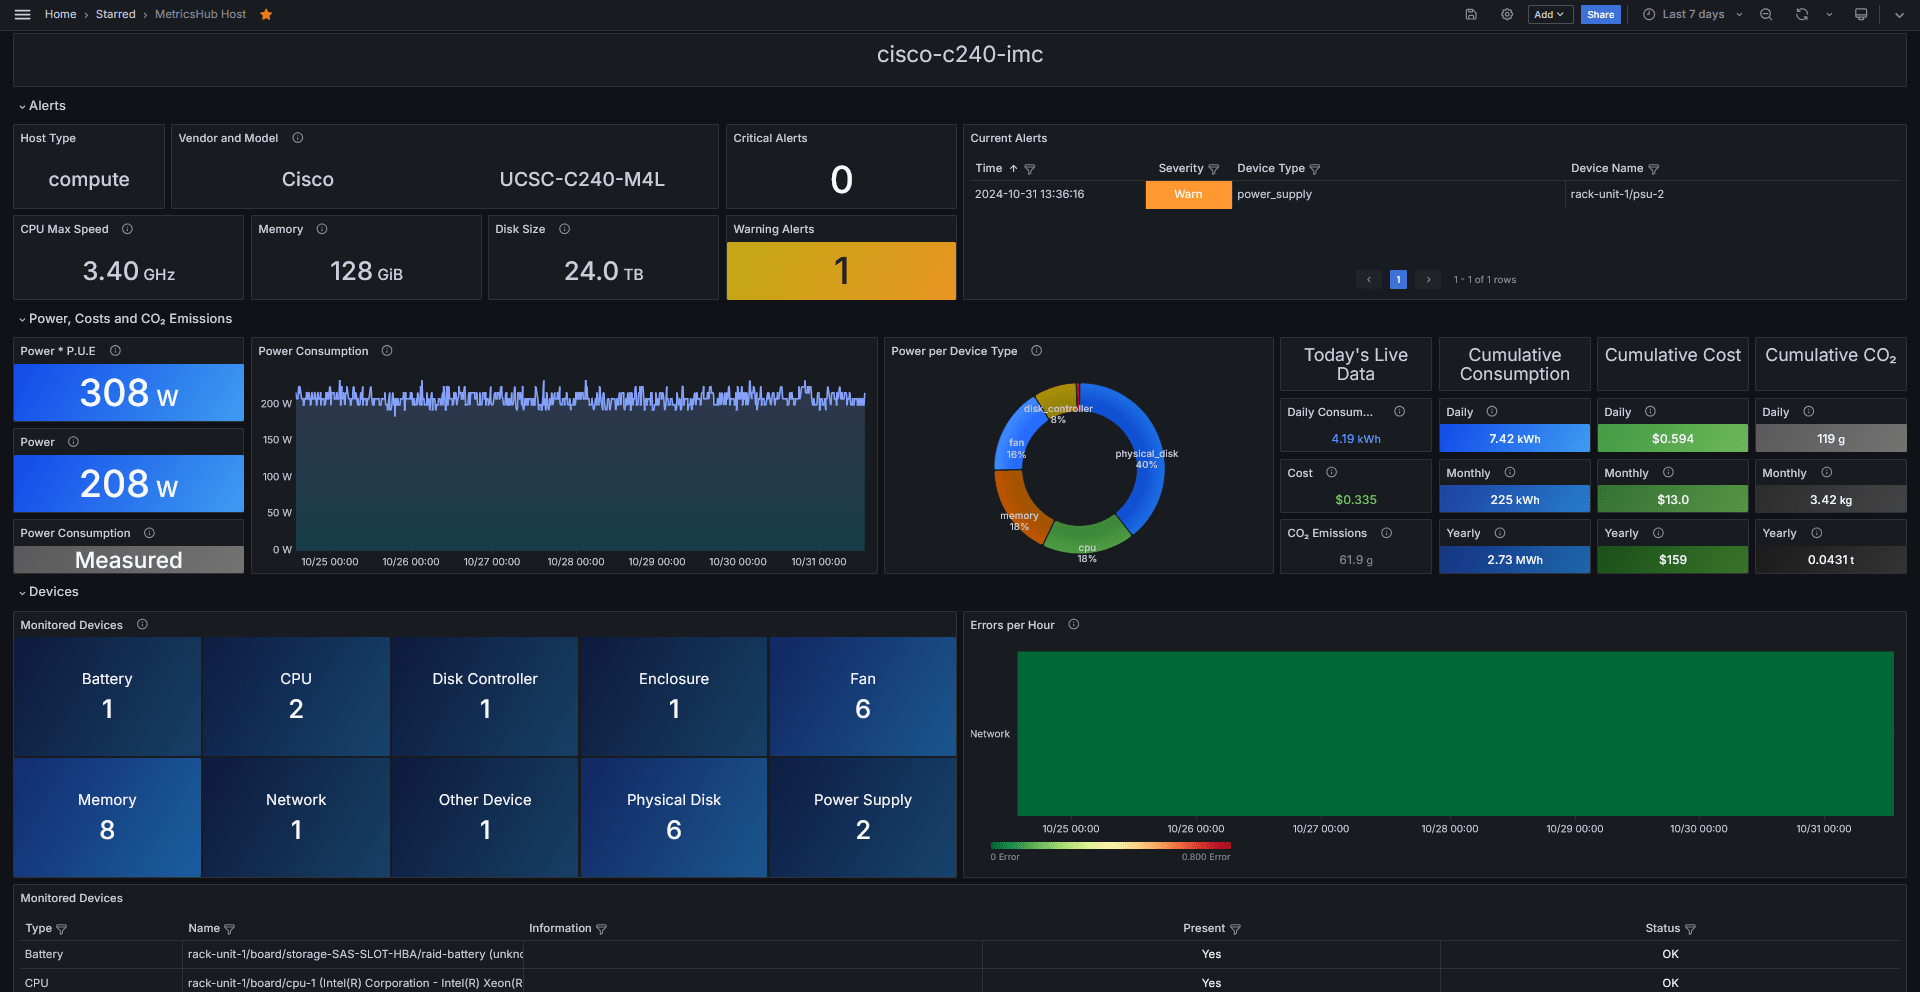
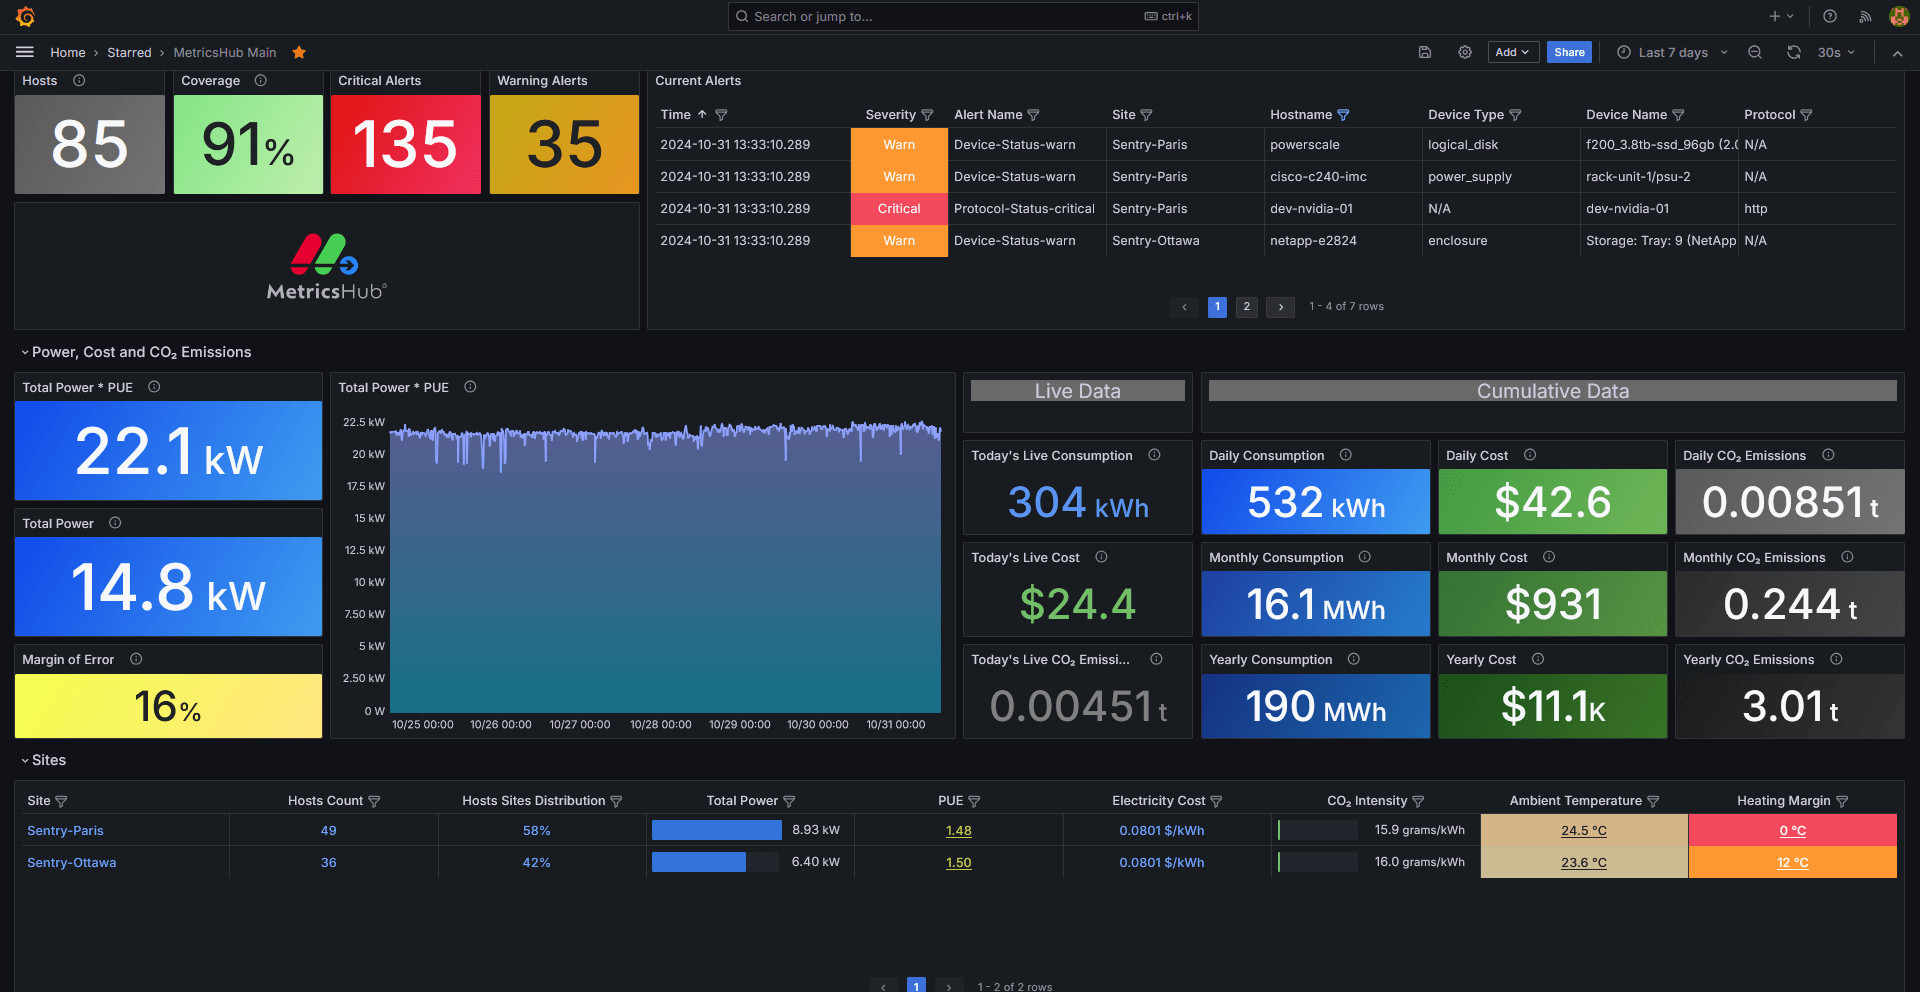
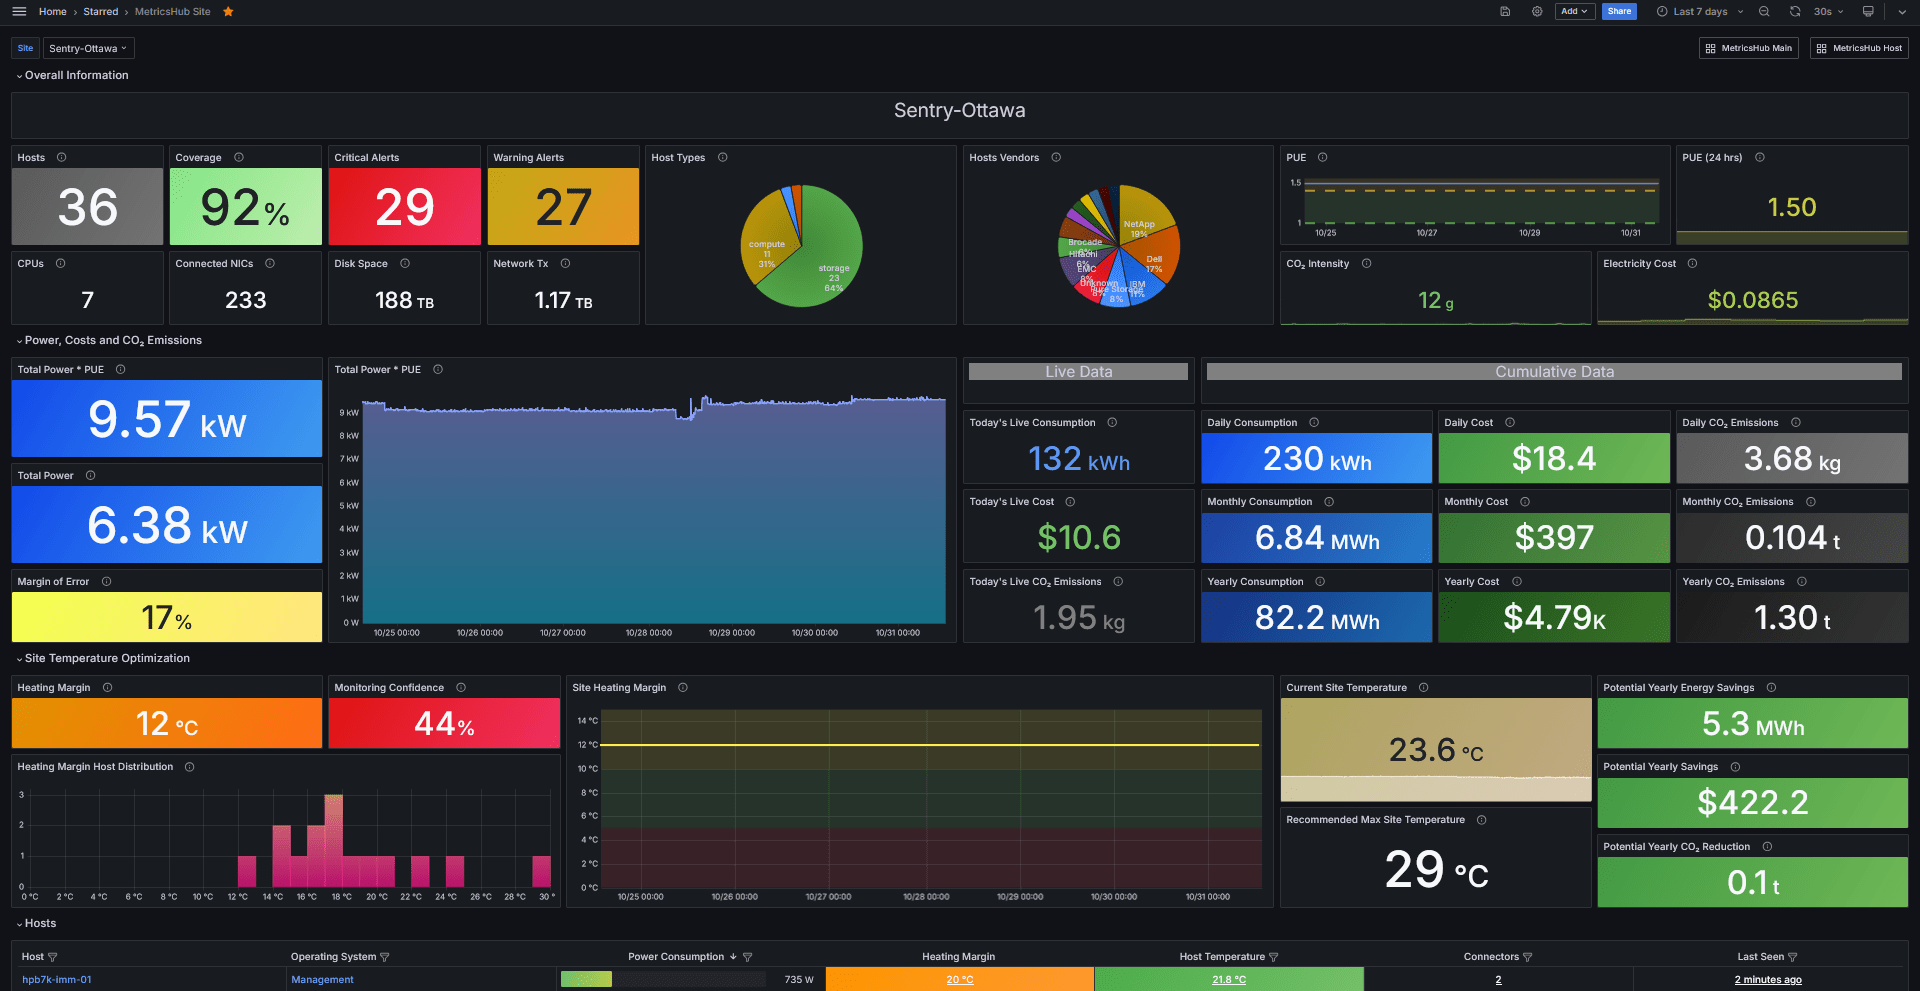

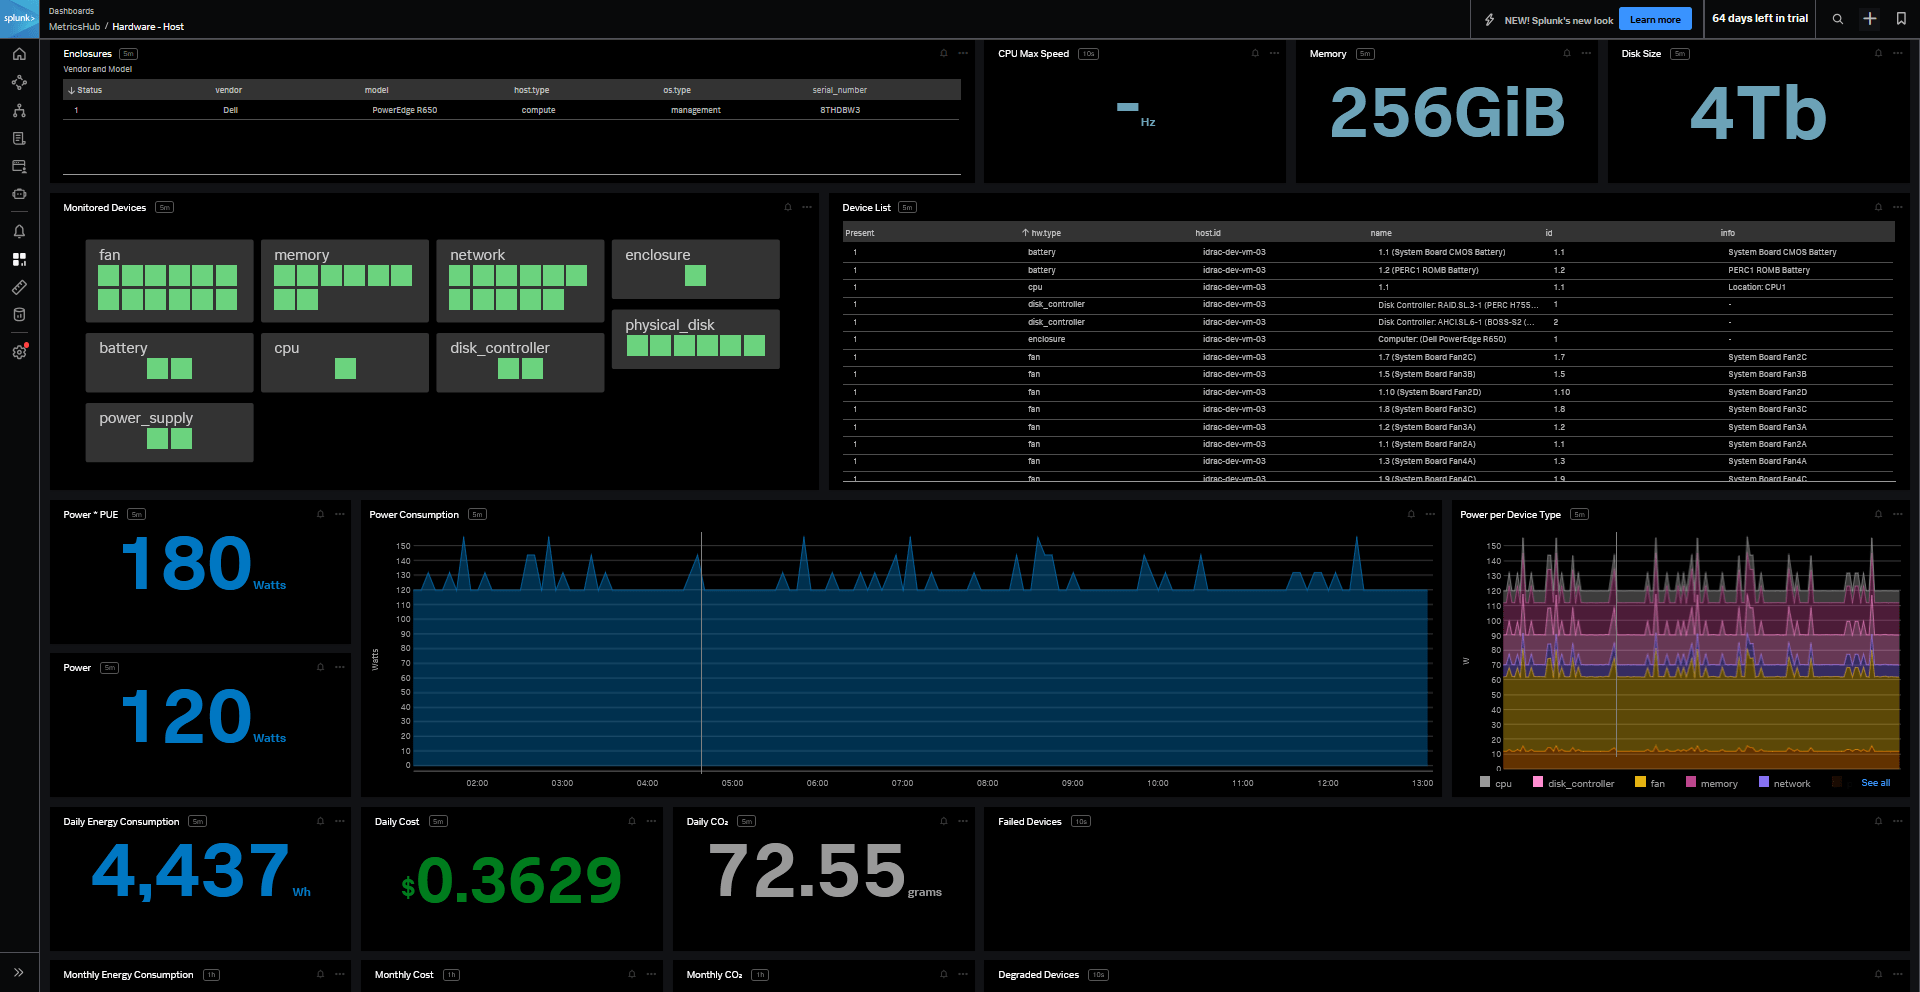
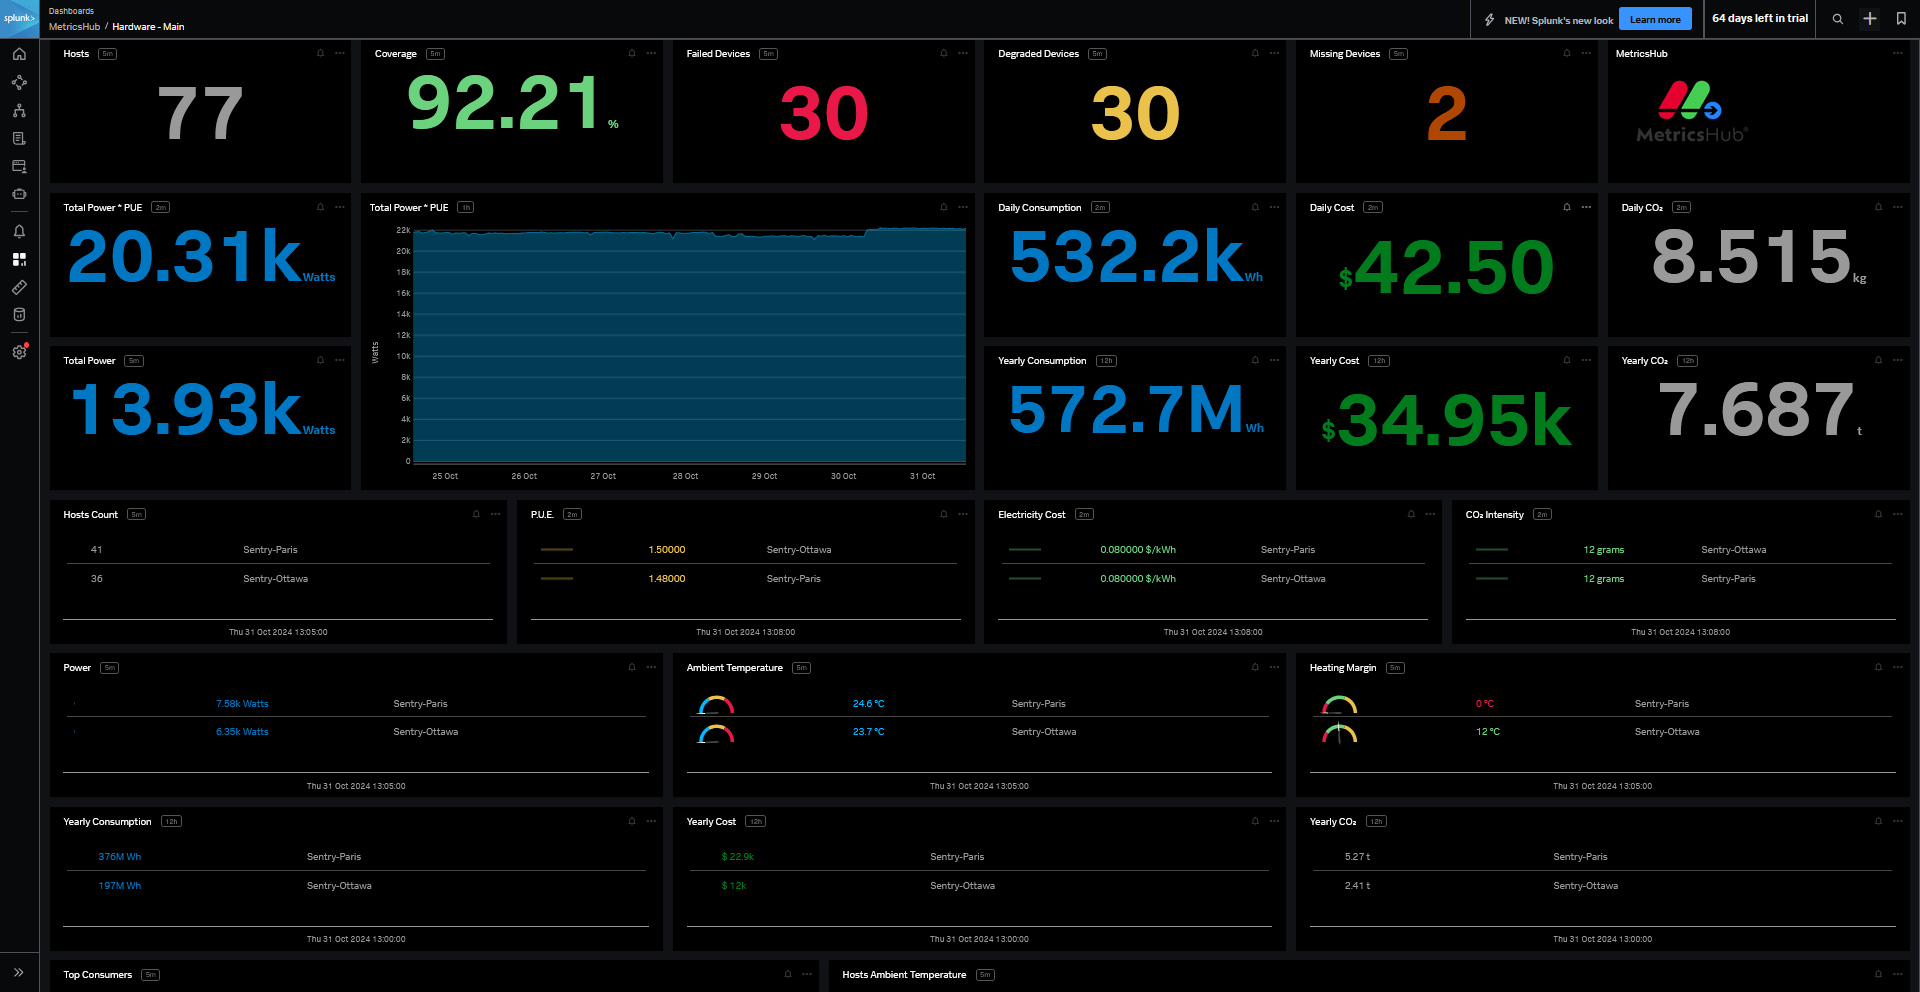
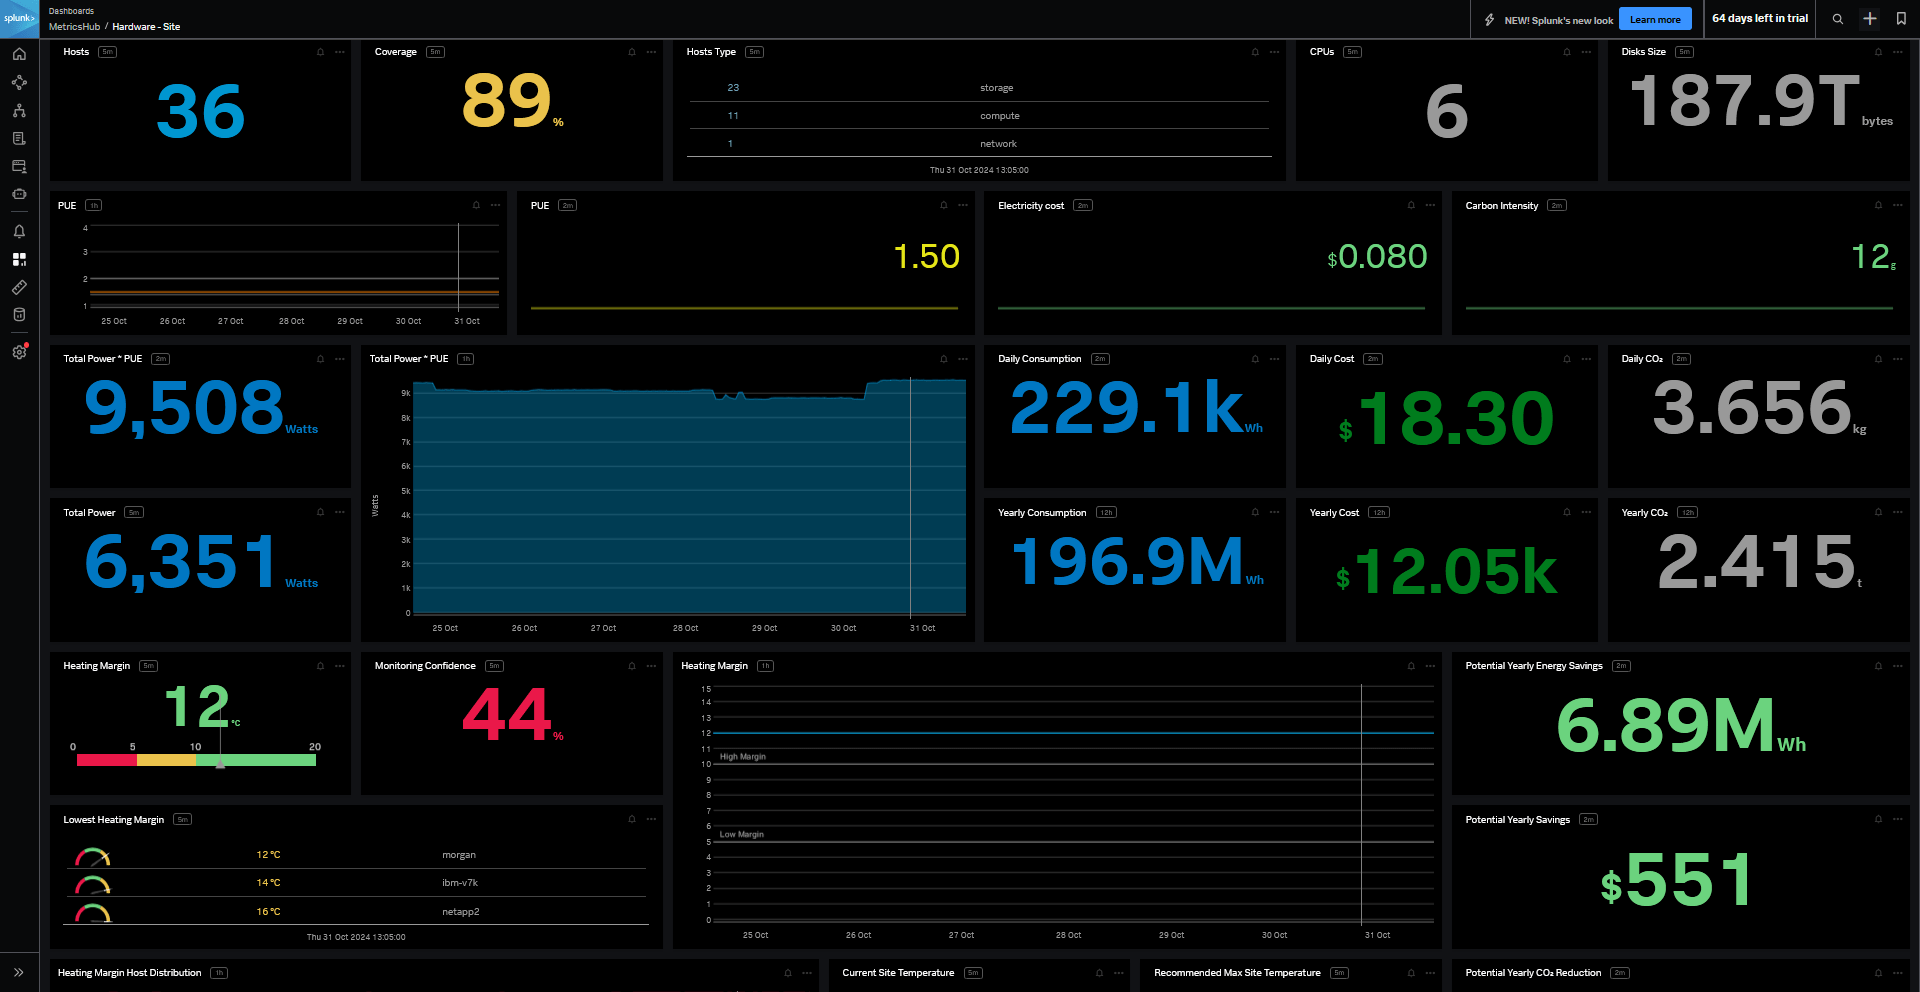


Make Your IT Infrastructure Greener: Save Energy, Cut Costs
- Monitor energy usage, electricity costs, and carbon footprint.
- Reduce energy spending through data-driven optimization of data center temperature.
- Ensure compliance with current and future regulations.


Ensure 100% Project Success With MetricsHub® Support Desk
- Achieve deployment in complex and large environments safely and quickly
- Rely on a team of certified experts to overcome unpredictable roadblocks
- Get the most out of Prometheus with specialized technical support
- Interact with real people - no chat bot

Latest Blog Posts
To give our users a solid answer backed by real data, we recently conducted an in-depth load testing experiment using server emulation and real-world lab systems. Hear what we did, what we learned, and how to interpret findings.
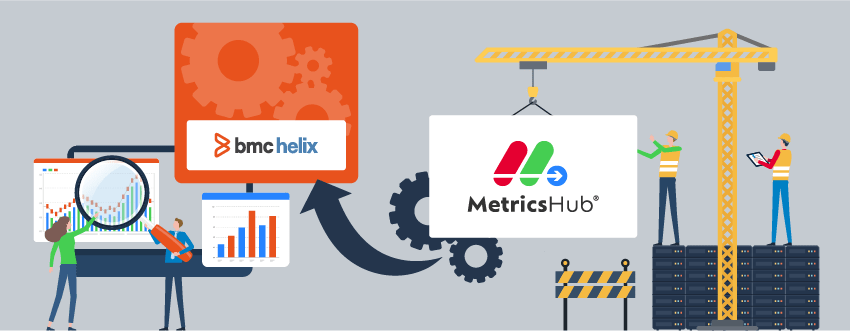
Discover how a simple idea grew into a powerful OpenTelemetry Collector component that connects observability pipelines to BMC Helix Operations Management.
How MetricsHub detects HP ProLiant servers, Brocade SAN switches, or any other system for monitoring purposes.
Join us on Slack
Engage with our team, ask questions, and provide valuable feedback that shapes the future of our product.
Get invite